Kubernetes in Action
关键字:容器编排,Kubernetes,云原生
背景介绍
容器编排
容器技术的核心概念是容器,镜像,仓库。使用这三大基本要素就可以轻松地完成应用的打包,分发工作,实现“一次分发,到处运行”的梦想。不过,当要在服务器集群里大规模实施的时候,却会发现容器技术的创新只是解决了运维部署工作中的一部分。除此之外,还包括服务发现,负载均衡,状态监控,健康检查,动态扩缩容等。
这些容器之上的管理,调度工作,就是所谓的“容器编排”(Container Orchestration)。面对单机上的几个容器,“人肉”编排调度还可以应付,但如果面对规模成千上万的容器,处理它们之间的复杂联系就必须依靠计算机了,而目前计算机用来调度管理的“事实标准”,就是 Kubernetes。
Kubernetes
作为世界上最大的搜索引擎,Google 拥有数量庞大的服务器集群,为例提高资源利用率和部署运维效率,专门开发了一个集群管理系统 Borg。在 2014 年,因为之前在发表 MapReduce,BigTable,GFS 时吃过亏,被 Yahoo 开发的 Hadoop 占领了市场,所以 Google 决定借着 Docker 的“东风”,在发表论文的同时,把 C++ 开发的 Borg 系统用 Go 语言重写并开源,于是 Kubernetes 就这样诞生了。然后,在 2015 年,Google 又联合 Linux 基金会成立了 CNCF (Cloud Native Computing Foundation,云原生基金会),并把 Kubernetes 捐献出来作为种子项目。有了 Google 和 Linux 这两大家族的保驾护航,再加上宽容开放的社区,Kubernetes 仅用了两年的时间就打败了同期的竞争对手 Apache Mesos 和 Docker Swarm,成为了这个领域的唯一霸主。
简单来说,Kubernetes 就是一个生产级别的容器编排平台和集群管理系统,不仅能够创建,调度容器,还能够监控,管理服务器,从而可以具备运维海量计算节点,即云计算的能力。
Borg 系统的名字来自于《星际迷航》(Star Trek)里的外星人种族,Kubernetes 在开发之初为了延续与 Borg 的关系,使用了一个代号 Seven of Nine ,即 Borg 与地球文明之间联络人的名字,隐喻从内部系统到开源项目,所以 Kubernetes 的标志有七条轮辐。Kubernetes 这个词来自希腊语,意思是“舵手”,“领航员”,可以理解成是操控着满载集装箱(容器)大船的指挥官。Kubernetes 有时候会缩写成 “k8s”,这个是因为 k 和 s 之间有 8 个字符,类似的还有 i18n (internationalization)
Kubernetes 的基本架构
操作系统用来管理软件和硬件。Kubernetes 可以说是一个集群级别的操作系统,主要功能就是资源管理和作业调度。操作系统的一个重要功能就是抽象,从繁琐的底层事务中抽象出一些简洁的概念,然后基于这些概念去管理系统资源。
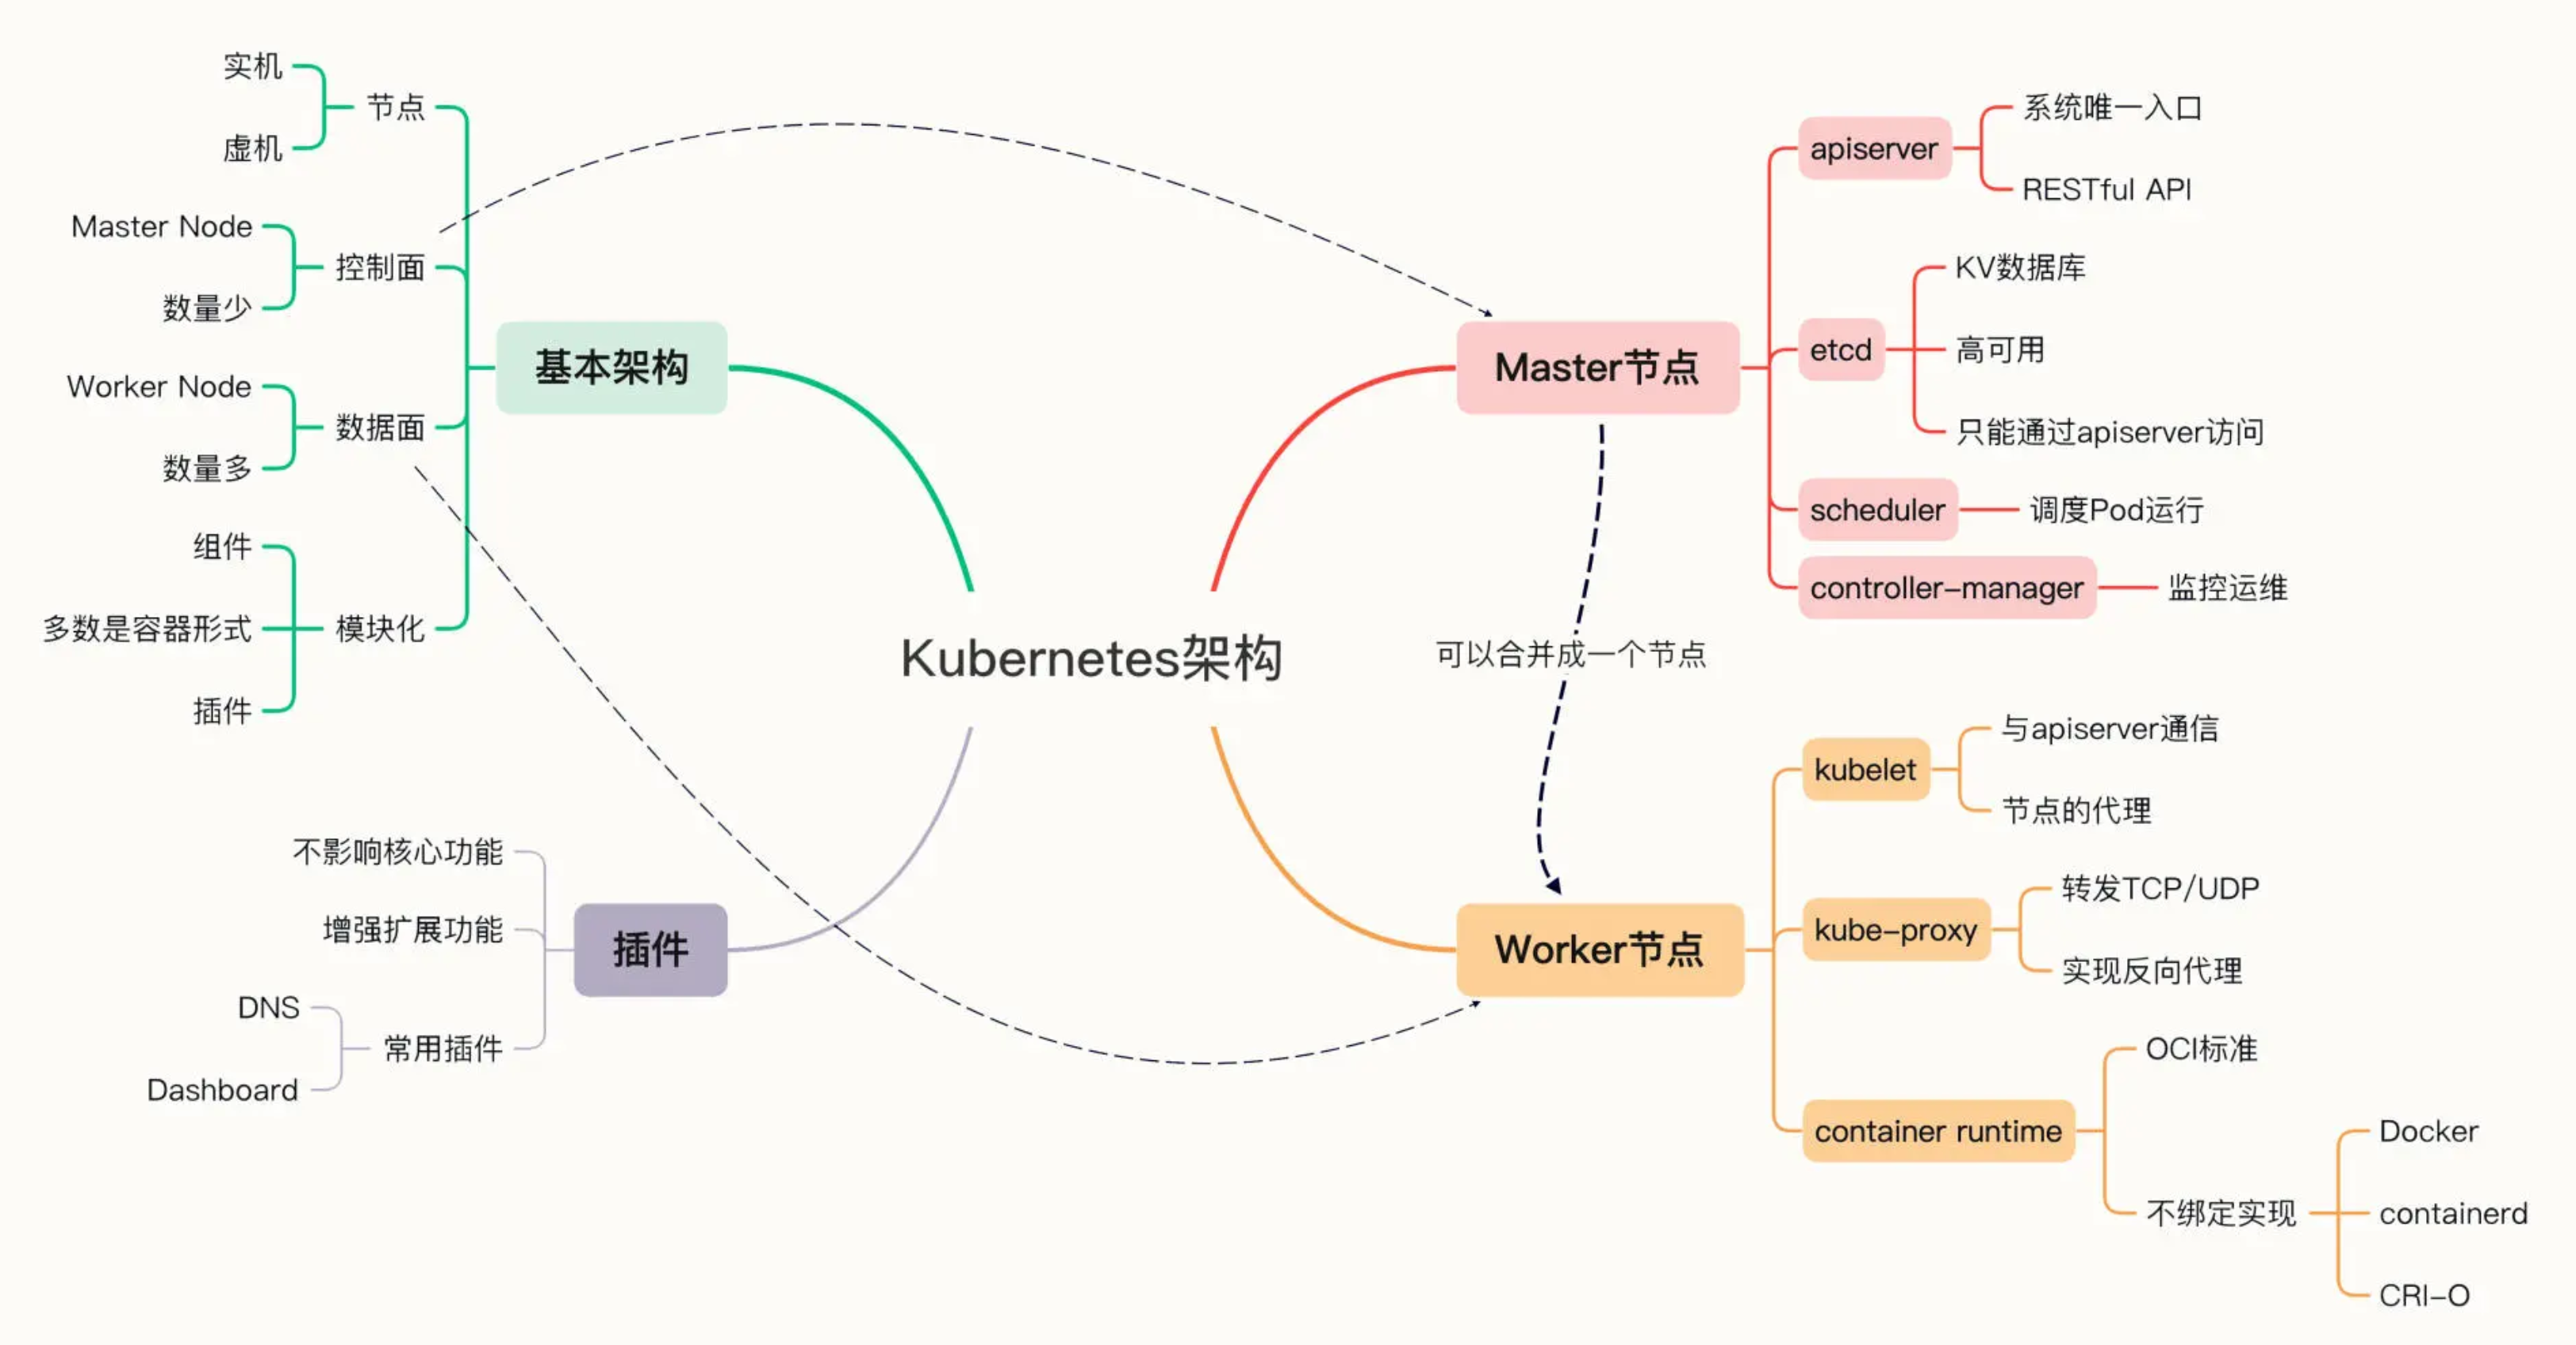
Kubernetes 采用了现今流行的“控制面 / 数据面”(Control Plane / Data Plane)架构,集群里的计算机被称为“节点”(Node),可以是实机也可以是虚机,少量的节点用作控制面来执行集群的管理维护工作,其他的大部分节点都被划归数据面,用来跑业务应用。
控制面的节点在 Kubernetes 里叫做 Master Node,一般简称为 Master,它是整个集群里最重要的部分,可以说是 Kubernetes 的大脑和心脏。
数据面的节点叫做 Worker Node,一般就简称为 Worker 或者 Node,相当于 Kubernetes 的手和脚,在 Master 的指挥下干活。
Node 的数量非常多,构成了一个资源池,Kubernetes 就在这个池里分配资源,调度应用。因为资源被“池化”了,所以管理也就变得比较简单,可以在集群中任意添加或者删除节点。
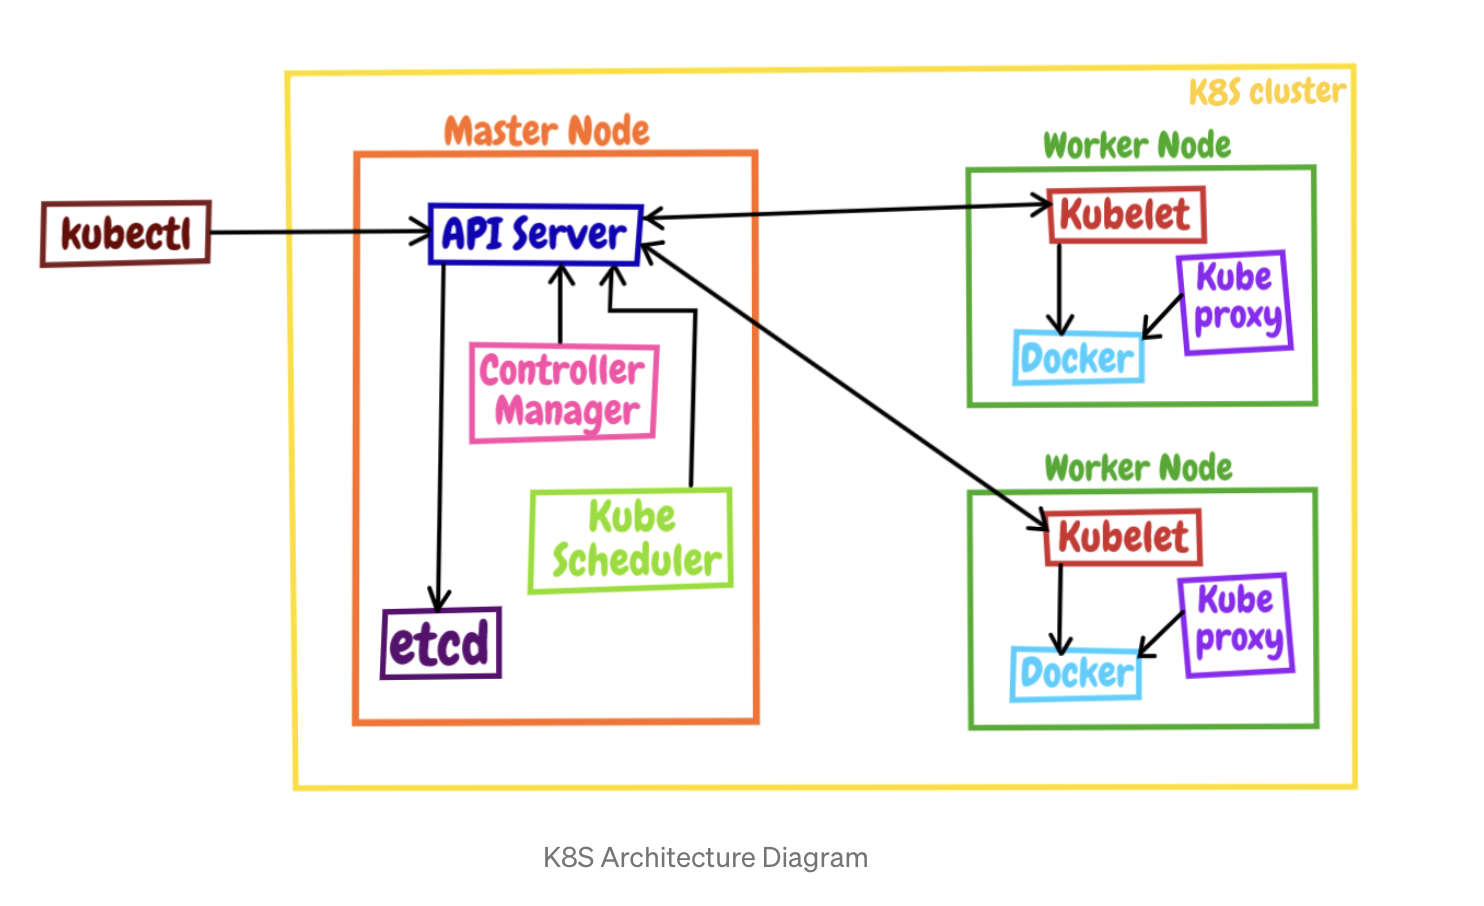
Kubernetes 的大致工作流程:
- 每个 Node 上的 kubelet 会定期向 apiserver 上报节点状态,apiserver 再存到 etcd 里。
- 每个 Node 上的 kube-proxy 实现了 TCP/UDP 反向代理,让容器对外提供稳定的服务。
- scheduler 通过 apiserver 得到当前的节点状态,调度 Pod,然后 apiserver 下发命令给某个 Node 的 kubelet,kubelet 调用 container-runtime 启动容器。
- controller-manager 也通过 apiserver 得到实时的节点状态,监控可能的异常情况,再使用相应的手段去调节恢复。
补充:
- 相比早期的架构,目前 Kubernetes 在控制面里多出了一个 cloud-controller-manager,顾名思义,是用来与特定云厂商连接进而控制 Kubernetes 对象的。
- 为了确保控制面的高可用,Kubernetes 集群里都会部署多个 Master 节点,数量一般会是奇数(3/5/7),这是由 etcd 的特性决定的。
- etcd 由 CoreOS 公司开发,基于类 Paxos 的 Raft 算法实现数据一致性。
内部结构
Kubernetes 的节点内部也具有复杂的结构,是由很多的模块构成的,这些模块又可以分成组件(Component)和插件(Addon)两类。
Master 的组件
Master 里有 4 个组件,分别是 apiserver、etcd、scheduler、controller-manager。
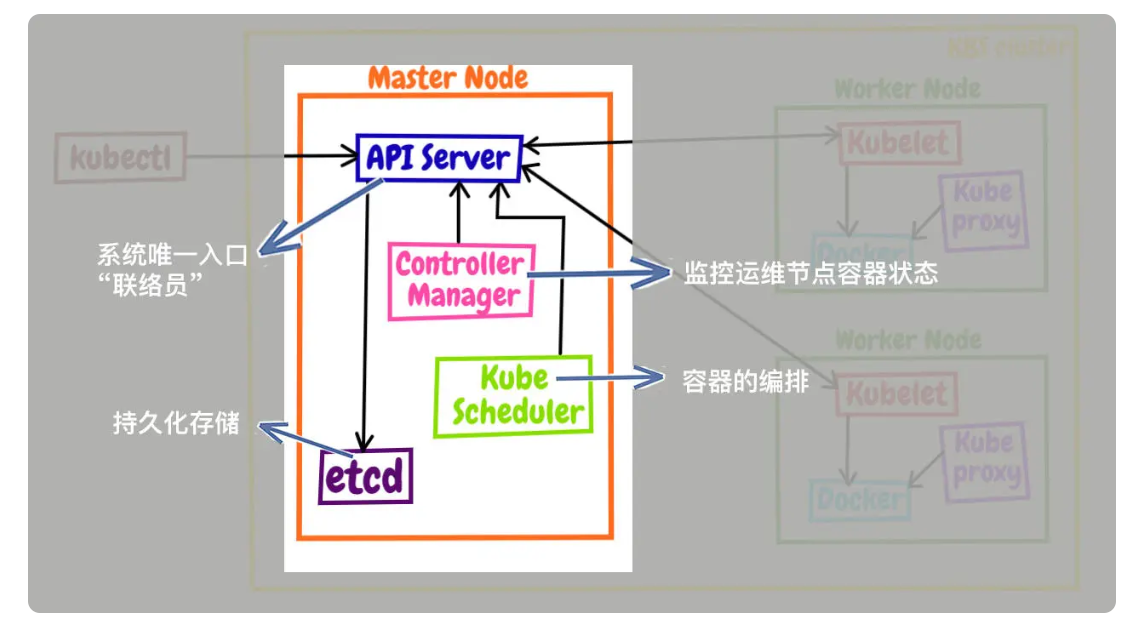
- apiserver 是 Master 节点,同时也是整个 Kubernetes 系统的唯一入口,它对外公开了一系列的 RESTful API,并且加上了验证、授权等功能,所有其他组件都只能和它直接通信,可以说是 Kubernetes 里的联络员。
- etcd 是一个高可用的分布式 Key-Value 数据库,用来持久化存储系统里的各种资源对象和状态,相当于 Kubernetes 里的配置管理员。注意它只与 apiserver 有直接联系,也就是说任何其他组件想要读写 etcd 里的数据都必须经过 apiserver。
- scheduler 负责容器的编排工作,检查节点的资源状态,把 Pod 调度到最适合的节点上运行,相当于部署人员。因为节点状态和 Pod 信息都存储在 etcd 里,所以 scheduler 必须通过 apiserver 才能获得。
- controller-manager 负责维护容器和节点等资源的状态,实现故障检测、服务迁移、应用伸缩等功能,相当于监控运维人员。同样地,它也必须通过 apiserver 获得存储在 etcd 里的信息,才能够实现对资源的各种操作。
这 4 个组件也都被容器化了,运行在集群的 Pod 里,可以用 kubectl 来查看它们的状态:
$ kubectl get pod -n kube-system
NAME                               READY   STATUS             RESTARTS          AGE
coredns-64897985d-256jm            0/1     CrashLoopBackOff   320 (4m29s ago)   23h
etcd-minikube                      1/1     Running            0                 23h
kube-apiserver-minikube            1/1     Running            0                 23h
kube-controller-manager-minikube   1/1     Running            0                 23h
kube-proxy-hvmcp                   1/1     Running            0                 23h
kube-scheduler-minikube            1/1     Running            0                 23h
storage-provisioner                1/1     Running            1 (23h ago)       23h
注意:命令行里要用 -n kube-system 参数,表示检查 kube-system 名字空间里的 Pod
Node 的组件
Node 里的 3 个组件,分别是 kubelet、kube-proxy、container-runtime
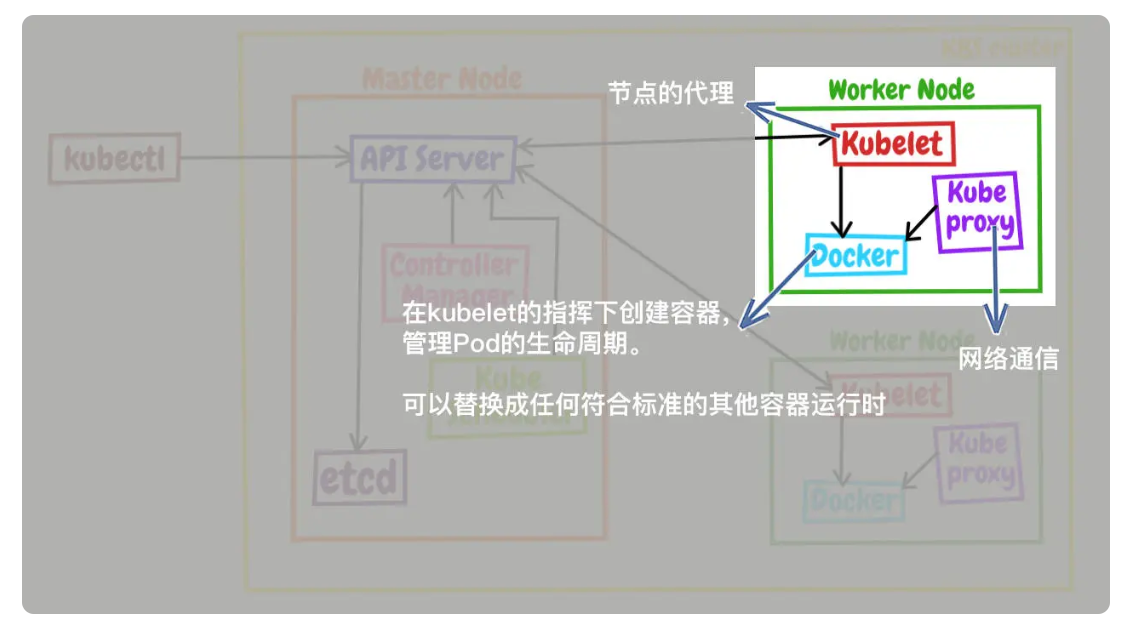
- kubelet 是 Node 的代理,负责管理 Node 相关的绝大部分操作,Node 上只有它能够与 apiserver 通信,实现状态报告、命令下发、启停容器等功能,相当于是 Node 上的一个“小管家”。
- kube-proxy 的作用有点特别,它是 Node 的网络代理,只负责管理容器的网络通信,简单来说就是为 Pod 转发 TCP/UDP 数据包,相当于是专职的“小邮差”。
- container-runtime 是容器和镜像的实际使用者,在 kubelet 的指挥下创建容器,管理 Pod 的生命周期,是真正干活的“苦力”。
这 3 个组件中只有 kube-proxy 被容器化了,而 kubelet 因为必须要管理整个节点,容器化会限制它的能力,所以它必须在 container-runtime 之外运行。minikube ssh 登录到节点,可以用 docker ps | grep kube-proxy 看到 kube-proxy,而 kubelet 用 docker ps 是找不到的,需要用操作系统的 ps 命令查看。
注意:因为 Kubernetes 的定位是容器编排平台,所以它没有限定 container-runtime 必须是 Docker,完全可以替换成任何符合标准的其他容器运行时,例如 containerd、CRI-O 等
插件(Addons)
只要服务器节点上运行了 apiserver、scheduler、kubelet、kube-proxy、container-runtime 等组件,就可以说是一个功能齐全的 Kubernetes 集群了。不过就像 Linux 一样,操作系统提供的基础功能虽然“可用”,但想达到“好用”的程度,还是要再安装一些附加功能,这在 Kubernetes 里就是插件(Addon)。
由于 Kubernetes 本身的设计非常灵活,所以就有大量的插件用来扩展、增强它对应用和集群的管理能力。minikube 也支持很多的插件,使用命令 minikube addons list 就可以查看插件列表:
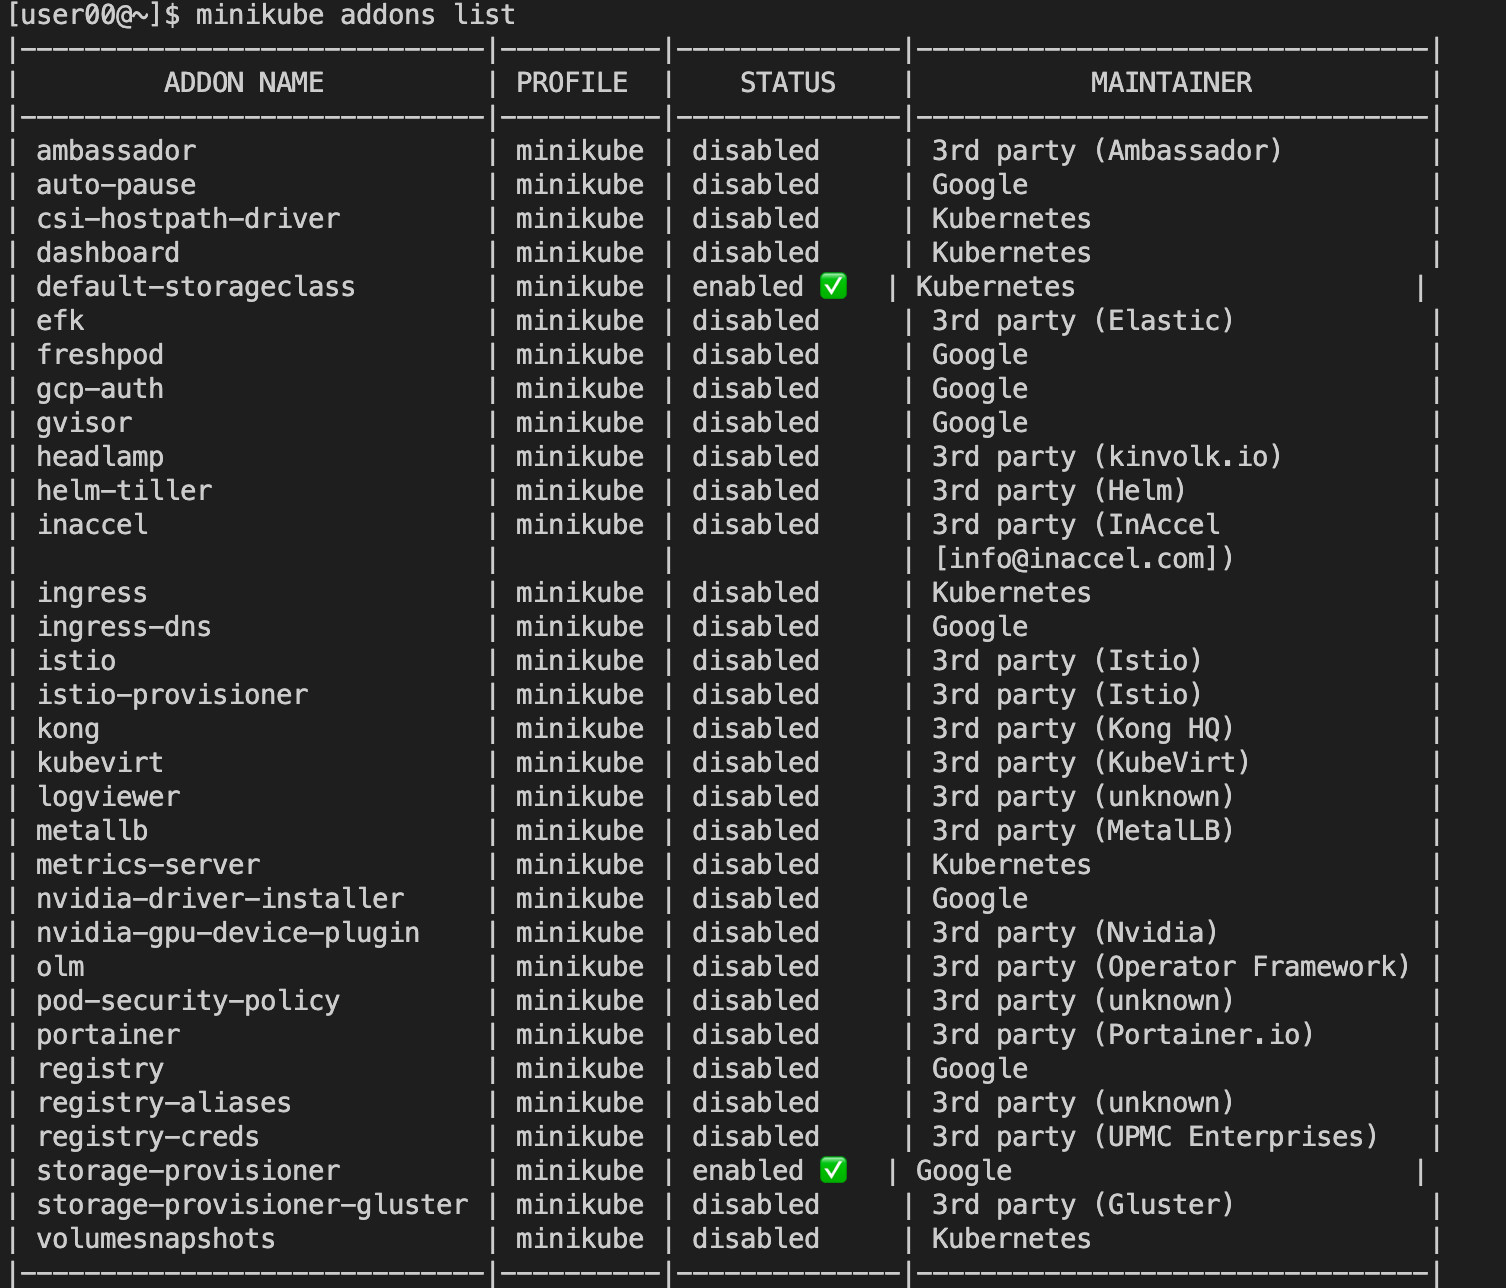
通常必备的插件有 DNS 和 Dashboard。只要在 minikube 环境里执行一条简单的命令 minikube dashboard,就可以自动用浏览器打开 Dashboard 页面,而且还支持中文。
Service
Service 是 k8s 的一种抽象:一个 Pod 的逻辑分组,一种可以访问它们的策略,通常称为微服务。这一组 Pod 能够被 Service 访问到,通常是通过 Label Selector 实现。
Service 类型
-
ClusterIP: 提供一个集群内部的虚拟 IP 以供 Pod 访问 (Service 默认类型) -
NodePort: Pod 在调度到的 Node 上打开一个端口以供外部访问 -
LoadBalancer: 在 NodePort 的基础上,借助 cloud provider 创建一个外部负载均衡器,并将请求转发到 NodePort -
ExternalName: 把集群外部的服务引入到集群内部来,在集群内部直接使用
https://jimmysong.io/kubernetes-handbook/concepts/service.html
关键概念
调度、抢占和驱逐
在 Kubernetes 中:
- 调度(
Scheduling)确保 Pod 匹配到合适的节点,以便 kubelet 能够运行它们。 - 抢占(
Preemption)终止低优先级的 Pod 以便高优先级的 Pod 可以调度运行的过程。 - 驱逐(
Eviction)是在资源匮乏的节点上,主动让一个或多个 Pod 失效的过程。
kubectl 常用命令
kubectl [command] [TYPE] [NAME] [flags]
kubectl help

kubectl version
kubectl cluster-info

kubectl get nodes
kubectl get namespaces

# 获取 namespace 下 nodes 信息
kubectl get nodes --namespace dev-test-gerry -o wide

# 获取 namespace 下 pods 信息
kubectl get pods --namespace dev-test-gerry -o wide

# 获取 namespace 下 某个 pod 的 container 信息
kubectl get pods deploy-redis1-7ffdbff548-2k4sf --namespace dev-test-gerry -o jsonpath='{.spec.containers[*].name}'

kubectl describe nodes --namespace dev-test-gerry
kubectl describe pods --namespace dev-test-gerry
kubectl describe pods deploy-redis1-7ffdbff548-2k4sf --namespace dev-test-gerry

kubectl logs deploy-redis1-7ffdbff548-2k4sf --namespace dev-test-gerry

kubectl get services --namespace dev-test-gerry

kubectl get deployments --namespace dev-test-gerry

# 查询 namespace 下 pods 的容器镜像
kubectl get pods --namespace dev-test-gerry -o jsonpath="{.items[*].spec.containers[*].image}"
kubectl get pods --namespace dev-test-gerry -o go-template --template="{{range .items}}{{range .spec.containers}}{{.image}} {{end}}{{end}}"

# 查询所有 namespace 下 pods 的容器镜像
kubectl get pods --all-namespaces -o jsonpath='{range .items[*]}{"\n"}{.metadata.name}{":\t"}{range .spec.containers[*]}{.image}{", "}{end}{end}' |\ sort

# 登录 Pod
kubectl exec -it <pod-name> -n <namespace> -- /bin/bash

# 查看 Pod 中的容器列表
kubectl get pod <pod-name> -n <namespace> -o jsonpath='{.spec.containers[*].name}'

# 登录到指定容器
kubectl exec -it <pod-name> -n <namespace> -c <container-name> -- /bin/bash
kubectl exec -it deploy-redis1-7ffdbff548-2k4sf -c container-redis-default --namespace dev-test-gerry bash


# 删除异常 Pod
kubectl delete pods $pod-name -n dev --grace-period=0 --force

# 根据 Pod IP 查询 Pod
## 全集群搜索
kubectl get pods --all-namespaces -o wide | grep "$PodIP"
## JSON 格式查询
kubectl get pods --all-namespaces -o json | jq -r '.items[] | select(.status.podIP=="$PodIP") | .metadata.namespace + "/" + .metadata.name'
## 字段选择器
kubectl get pods --all-namespaces --field-selector status.podIP="$PodIP"


# 清理 Evicted 状态的 Pod
kubectl get pods --namespace autoworlds | grep Evicted | awk '{print $1}' | xargs kubectl delete pod --namespace autoworlds
kubectl get pods --namespace autoworlds | grep Evicted | awk '{print $1}' | xargs -I {} kubectl delete pod --namespace autoworlds {} --force --grace-period=0 # 强制删除
Kubernetes 工具
https://kubernetes.io/zh-cn/docs/tasks/tools/
kubectl
kubectl 是 Kubernetes 的命令行工具,使得可以对 Kubernetes 集群运行命令。可使用 kubectl 来部署应用、监测和管理集群资源以及查看日志。关于 kubectl 的更多用法可参考:https://kubernetes.io/zh-cn/docs/reference/kubectl/
minikube
minikube 是一个工具,能在本地运行 Kubernetes。 minikube 在本地的个人计算机(包括 Windows、macOS 和 Linux PC)运行一个单节点的 Kubernetes 集群,以便来尝试 Kubernetes 或者开展每天的开发工作。开始使用
minikube is local Kubernetes, focusing on making it easy to learn and develop for Kubernetes.
All you need is Docker (or similarly compatible) container or a Virtual Machine environment, and Kubernetes is a single command away: minikube start
minikube 集成了 Kubernetes 的绝大多数功能特性,不仅有核心的容器编排功能,还有丰富的插件,例如:Dashboard,Ingress,Istio 等。从而可通过 minikube 来学些 Kubernetes。
搭建 minikube 环境
minikube 支持 Mac,Windows,Linux 这三种主流平台,可以在 https://minikube.sigs.k8s.io 官网找到详细的安装说明。
说明:minikube 不包含在系统自带的 apt/yum 软件仓库里,只能自己去网上找安装包。不过因为它是用 Go 语言开发的,整体就是一个二进制文件,没有多余的依赖,所以安装过程非常简单,只需要用 curl 或者 wget 下载就行。下载的时候,需要注意计算机的硬件架构,Intel 芯片要选择带 amd64 后缀,Apple M1 芯片要选择 arm64 后缀,如果选错了就会因为 CPU 指令集不同而无法运行。
安装脚本:
#!/bin/bash

curl -Lo minikube https://storage.googleapis.com/minikube/releases/latest/minikube-linux-amd64
sudo install minikube /usr/local/bin/
echo "done"
安装完成:
$ ls -lh `which minikube`
-rwxr-xr-x 1 root root 73M Aug 25 09:44 /usr/local/bin/minikube

$ minikube version
minikube version: v1.26.1
commit: 62e108c3dfdec8029a890ad6d8ef96b6461426dc
不过 minikube 只能够搭建 Kubernetes 环境,要操作 Kubernetes,还需要另一个专门的客户端工具 kubectl。所以,在 minikube 环境里,会用到两个客户端:minikube 管理 Kubernetes 集群环境,kubectl 操作实际的 Kubernetes 功能。kubectl 是一个与 Kubernetes、minikube 彼此独立的项目,所以不包含在 minikube 里,但 minikube 提供了安装它的简化方式,只需执行下面的这条命令,就会把与当前 Kubernetes 版本匹配的 kubectl 下载下来,存放在内部目录(例如 .minikube/cache/linux/arm64/v1.23.3),然后就可以使用它来对 Kubernetes“发号施令”了。
#!/bin/bash

minikube kubectl
echo "done"
使用命令 minikube start 会从 Docker Hub 上拉取镜像,以当前最新版本的 Kubernetes 启动集群。不过为了保证实验环境的一致性,可以在后面再加上一个参数 –kubernetes-version,明确指定要使用 Kubernetes 版本。
#!/bin/bash
# start_minikube.sh

minikube start --kubernetes-version=v1.23.3
echo "done"
$ ./start_minikube.sh
* minikube v1.26.1 on Centos 7.2 (amd64)
* Automatically selected the docker driver
! For improved Docker performance, Upgrade Docker to a newer version (Minimum recommended version is 20.10.0, minimum supported version is 18.09.0, current version is 18.09.7)
* Using Docker driver with root privileges
* Starting control plane node minikube in cluster minikube
* Pulling base image ...
* Downloading Kubernetes v1.23.3 preload ...
    > preloaded-images-k8s-v18-v1...:  400.43 MiB / 400.43 MiB  100.00% 7.40 Mi
    > gcr.io/k8s-minikube/kicbase:  386.60 MiB / 386.61 MiB  100.00% 5.16 MiB p
    > gcr.io/k8s-minikube/kicbase:  0 B [_______________________] ?% ? p/s 1m8s
! minikube was unable to download gcr.io/k8s-minikube/kicbase:v0.0.33, but successfully downloaded gcr.io/k8s-minikube/kicbase:v0.0.33 as a fallback image
* Creating docker container (CPUs=2, Memory=7900MB) ...
* Preparing Kubernetes v1.23.3 on Docker 20.10.17 ...
  - Generating certificates and keys ...
  - Booting up control plane ...
  - Configuring RBAC rules ...
* Verifying Kubernetes components...
  - Using image gcr.io/k8s-minikube/storage-provisioner:v5
* Enabled addons: storage-provisioner, default-storageclass
* kubectl not found. If you need it, try: 'minikube kubectl -- get pods -A'
* Done! kubectl is now configured to use "minikube" cluster and "default" namespace by default
done
$ docker image ls
REPOSITORY                                     TAG                 IMAGE ID            CREATED             SIZE
gcr.io/k8s-minikube/kicbase                    v0.0.33             b7ab23e98277        3 weeks ago         1.14GB
注意:由于国内网络环境的原因,下载 gcr.io 的镜像比较困难,minikube 提供了特殊的启动参数 –image-mirror-country=cn –registry-mirror=xxx –image-repository=xxx 等,如果遇到问题可以尝试下。例如:minikube start –image-mirror-country=’cn’ –kubernetes-version=v1.23.3 –force
现在 Kubernetes 集群就已经在本地运行了,可以使用下面命令来查看集群的状态:
$ minikube status
minikube
type: Control Plane
host: Running
kubelet: Running
apiserver: Running
kubeconfig: Configured
$ minikube node list
minikube        192.168.49.2
可以看到,Kubernetes 集群里现在只有一个节点,名字就叫 minikube,类型是 Control Plane,里面有 host、kubelet、apiserver 三个服务,IP 地址是 192.168.49.2。
可以用命令 minikube ssh 登录到这个节点上,虽然它是虚拟的,但用起来和实机也没什么区别:
$ minikube ssh
Last login: Thu Aug 25 02:04:57 2022 from 192.168.49.1
docker@minikube:~$ pwd
/home/docker
接下来就可以使用 kubectl 来操作一下,初步体会 Kubernetes 这个容器编排系统。
注意:因为使用 minikube 自带的 kubectl 有一点形式上的限制,要在前面加上 minikube 的前缀
$ minikube kubectl -- version
Client Version: version.Info{Major:"1", Minor:"23", GitVersion:"v1.23.3", GitCommit:"816c97ab8cff8a1c72eccca1026f7820e93e0d25", GitTreeState:"clean", BuildDate:"2022-01-25T21:25:17Z", GoVersion:"go1.17.6", Compiler:"gc", Platform:"linux/amd64"}
Server Version: version.Info{Major:"1", Minor:"23", GitVersion:"v1.23.3", GitCommit:"816c97ab8cff8a1c72eccca1026f7820e93e0d25", GitTreeState:"clean", BuildDate:"2022-01-25T21:19:12Z", GoVersion:"go1.17.6", Compiler:"gc", Platform:"linux/amd64"}
为了避免这个不大不小的麻烦,建议使用 Linux 的 alias 功能,为它创建一个别名,写到当前用户目录下的 .bashrc 里:
alias kubectl="minikube kubectl --"
之后就可以直接使用 kubectl 命令了。
$ kubectl version --short
Client Version: v1.23.3
Server Version: v1.23.3
下面在 Kubernetes 里运行一个 Nginx 应用,命令与 Docker 一样,也是 run,不过形式上有点区别,需要用 –image 指定镜像,然后 Kubernetes 会自动拉取并运行:
$ kubectl run ngx --image=nginx:alpine
pod/ngx created
$ kubectl get node
NAME       STATUS   ROLES                  AGE   VERSION
minikube   Ready    control-plane,master   23h   v1.23.3
$ kubectl get pod
NAME   READY   STATUS    RESTARTS   AGE
ngx    1/1     Running   0          3s
$ kubectl delete pod ngx
pod "ngx" deleted
$ kubectl get pod
No resources found in default namespace.
注意:通过 kubectl get node 查看 Kubernetes 的节点状态,可以看到当前的 minikube 集群里只有一个 Master,那 Node 怎么不见了?这是因为 Master 和 Node 的划分不是绝对的。当集群的规模较小,工作负载较少的时候,Master 也可以承担 Node 的工作,搭建的 minikube 环境,它就只有一个节点,这个节点既是 Master 又是 Node。
Tips
kubectl completion (补全功能)
参考kubectl completion -h
source <(kubectl completion bash)
container_memory_working_set_bytes 当前工作集使用量 (limit 限制时 OOM 判断依据)
container_memory_working_set_bytes 是 Kubernetes 中用于监控容器内存使用情况的一个重要指标。它表示容器当前活跃使用的内存量,不包括缓存,是容器真实使用的内存量。这个指标在 Kubernetes 中被广泛用于资源限制和 OOM(Out Of Memory) killer 的判断依据。具体来说,container_memory_working_set_bytes 的计算方式通常是 memory.usage_in_bytes - total_inactive_file,即总内存使用量减去不活跃的文件缓存。这个值反映了容器当前不能被回收的内存部分,因此是 OOM killer 在决定是否终止容器时的重要参考指标。
如何计算 container_memory_working_set_bytes 内存使用量?
执行 kubectl top pod 命令得到的结果,并不是容器服务中 container_memory_usage_bytes 指标的内存使用量,而是指标 container_memory_working_set_bytes 的内存使用量,计算方法如下:
- container_memory_usage_bytes = container_memory_rss + container_memory_cache + kernel memory
container_memory_working_set_bytes= container_memory_usage_bytes - total_inactive_file(未激活的匿名缓存页)
在容器内,计算某个容器的内存使用情况:
#!/bin/bash

memory_stat_file="/sys/fs/cgroup/memory/memory.stat"

total_rss=$(grep "total_rss " ${memory_stat_file} | awk '{print $2}')
total_cache=$(grep "total_cache " ${memory_stat_file} | awk '{print $2}')
total_shmem=$(grep "total_shmem " ${memory_stat_file} | awk '{print $2}')
total_inactive_file=$(grep "total_inactive_file " ${memory_stat_file} | awk '{print $2}')

container_memory_working_set_bytes=$((total_rss + total_cache + total_shmem - total_inactive_file))

container_memory_working_set_MB=$(echo "scale=2; ${container_memory_working_set_bytes}/1048576" | bc)

echo "Container memory working set: ${container_memory_working_set_MB} MB"
在容器宿主机上,通过 cgroup_id 计算所属的 cgroup(控制组)的内存使用情况:
#!/bin/bash

if [ -z "$1" ]; then
  echo "Usage: $0 <container_name>"
  exit 1
fi

container_name="$1"
container_id=$(docker ps | grep $container_name | awk '{print $1}')

if [ -z "$container_id" ]; then
  echo "Container not found: $container_name"
  exit 1
fi

cgroup_id=$(docker inspect $container_id | grep CgroupParent | awk -F '"' '{print $4}')

memory_stat_file="/sys/fs/cgroup/memory/${cgroup_id}/memory.stat"

total_rss=$(grep "total_rss " ${memory_stat_file} | awk '{print $2}')
total_cache=$(grep "total_cache " ${memory_stat_file} | awk '{print $2}')
total_shmem=$(grep "total_shmem " ${memory_stat_file} | awk '{print $2}')
total_inactive_file=$(grep "total_inactive_file " ${memory_stat_file} | awk '{print $2}')

container_memory_working_set_bytes=$((total_rss + total_cache + total_shmem - total_inactive_file))

container_memory_working_set_MB=$(echo "scale=2; ${container_memory_working_set_bytes}/1048576" | bc)

echo "Container memory working set: ${container_memory_working_set_MB} MB"
问题: Memory usage discrepancy: cgroup memory.usage_in_bytes vs. RSS inside docker container
“Kubernetes” (v1.10.2) says that my pod (which contains one container) is using about 5GB memory. Inside the container, RSS is saying more like 681MiB. Can anypony explain how to get from 681MiB to 5GB with the following data (or describe how to make up the difference with another command I’ve omitted, either from the container or from the docker host that is running this container in kubernetes)?
kubectl top pods says 5GB:
% kubectl top pods -l app=myapp
NAME                             CPU(cores)   MEMORY(bytes)
myapp-56b947bf6d-2lcr7           39m          5039Mi
Cadvisor reports a similar number (might have been from a slightly different time, so please ignore small differences):
container_memory_usage_bytes{pod_name=~".*myapp.*"}      5309456384

5309456384 / 1024.0 / 1024 ~= 5063 ~= 5039
Inside the container, this file appears to be where cadvisor is getting its data:
% kubectl exec -it myapp-56b947bf6d-2lcr7 bash
meme@myapp-56b947bf6d-2lcr7:/app# cat /sys/fs/cgroup/memory/memory.usage_in_bytes
5309456384
The resident set size (RSS) inside the container does NOT match up (less than 1GB):
kb=$(ps aux | grep -v grep | grep -v 'ps aux' | grep -v bash | grep -v awk | grep -v RSS | awk '{print $6}' | awk '{s+=$1} END {printf "%.0f", s}'); mb=$(expr $kb / 1024); printf "Kb: $kb\nMb: $mb\n"

Kb: 698076
Mb: 681
Full ps aux in case that is helpful:
meme@myapp-56b947bf6d-2lcr7:/app# ps aux | grep -v grep | grep -v 'ps aux' | grep -v bash | grep -v awk
USER       PID %CPU %MEM    VSZ   RSS TTY      STAT START   TIME COMMAND
meme         1  0.0  0.0 151840 10984 ?        Ss   Jun04   0:29 /usr/sbin/apache2 -D FOREGROUND
www-data    10  0.0  0.0 147340  4652 ?        S    Jun04   0:00 /usr/sbin/apache2 -D FOREGROUND
www-data    11  0.0  0.0 148556  4392 ?        S    Jun04   0:16 /usr/sbin/apache2 -D FOREGROUND
www-data    12  0.2  0.0 2080632 11348 ?       Sl   Jun04  31:58 /usr/sbin/apache2 -D FOREGROUND
www-data    13  0.1  0.0 2080384 10980 ?       Sl   Jun04  18:12 /usr/sbin/apache2 -D FOREGROUND
www-data    68  0.3  0.0 349048 94272 ?        Sl   Jun04  47:09 hotapp
www-data   176  0.2  0.0 349624 92888 ?        Sl   Jun04  43:11 hotapp
www-data   179  0.2  0.0 349196 94456 ?        Sl   Jun04  42:20 hotapp
www-data   180  0.3  0.0 349828 95112 ?        Sl   Jun04  44:14 hotapp
www-data   185  0.3  0.0 346644 91948 ?        Sl   Jun04  43:49 hotapp
www-data   186  0.3  0.0 346208 91568 ?        Sl   Jun04  44:27 hotapp
www-data   189  0.2  0.0 350208 95476 ?        Sl   Jun04  41:47 hotapp
Memory section from docker’s container stats API:
curl --unix-socket /var/run/docker.sock 'http:/v1.24/containers/a45fc651e7b12f527b677e6a46e2902786bee6620484922016a135e317a42b4e/stats?stream=false' | jq . # yields:

"memory_stats": {
  "usage": 5327712256,
  "max_usage": 5368344576,
  "stats": {
    "active_anon": 609095680,
    "active_file": 74457088,
    "cache": 109944832,
    "dirty": 28672,
    "hierarchical_memory_limit": 5368709120,
    "inactive_anon": 1687552,
    "inactive_file": 29974528,
    "mapped_file": 1675264,
    "pgfault": 295316278,
    "pgmajfault": 77,
    "pgpgin": 85138921,
    "pgpgout": 84964308,
    "rss": 605270016,
    "rss_huge": 0,
    "shmem": 5513216,
    "total_active_anon": 609095680,
    "total_active_file": 74457088,
    "total_cache": 109944832,
    "total_dirty": 28672,
    "total_inactive_anon": 1687552,
    "total_inactive_file": 29974528,
    "total_mapped_file": 1675264,
    "total_pgfault": 295316278,
    "total_pgmajfault": 77,
    "total_pgpgin": 85138921,
    "total_pgpgout": 84964308,
    "total_rss": 605270016,
    "total_rss_huge": 0,
    "total_shmem": 5513216,
    "total_unevictable": 0,
    "total_writeback": 0,
    "unevictable": 0,
    "writeback": 0
  },
  "limit": 5368709120
},
A comment on https://github.com/google/cadvisor/issues/638 asserts:
Total (memory.usage_in_bytes) = rss + cache
https://www.kernel.org/doc/Documentation/cgroup-v1/memory.txt says:
usage_in_bytes: For efficiency, as other kernel components, memory cgroup uses some optimization to avoid unnecessary cacheline false sharing. usage_in_bytes is affected by the method and doesn’t show ‘exact’ value of memory (and swap) usage, it’s a fuzz value for efficient access. (Of course, when necessary, it’s synchronized.) If you want to know more exact memory usage, you should use RSS+CACHE(+SWAP) value in memory.stat(see 5.2).
https://docs.docker.com/engine/reference/commandline/stats/#parent-command says:
Note: On Linux, the Docker CLI reports memory usage by subtracting page cache usage from the total memory usage. The API does not perform such a calculation but rather provides the total memory usage and the amount from the page cache so that clients can use the data as needed.
And indeed, most of the stuff in /sys/fs/cgroup/memory/memory.stat in the container shows up in the above docker stats api response (slight differences are from taking the samples at a different time, sorry):
meme@myapp-56b947bf6d-2lcr7:/app# cat /sys/fs/cgroup/memory/memory.stat
cache 119492608
rss 607436800
rss_huge 0
shmem 5525504
mapped_file 1675264
dirty 69632
writeback 0
pgpgin 85573974
pgpgout 85396501
pgfault 296366011
pgmajfault 80
inactive_anon 1687552
active_anon 611213312
inactive_file 32800768
active_file 81166336
unevictable 0
hierarchical_memory_limit 5368709120
total_cache 119492608
total_rss 607436800
total_rss_huge 0
total_shmem 5525504
total_mapped_file 1675264
total_dirty 69632
total_writeback 0
total_pgpgin 85573974
total_pgpgout 85396501
total_pgfault 296366011
total_pgmajfault 80
total_inactive_anon 1687552
total_active_anon 611213312
total_inactive_file 32800768
total_active_file 81166336
total_unevictable 0
Memory info from kubectl describe pod <pod>:
Limits:
  memory:  5Gi
Requests:
  memory:  4Gi
Here’s what pmap says inside the container. In this one-liner, I get all process ids, run pmap -x on them, and pull the Kbytes column from the pmap results. The total result is 256 Megabytes (much less than ps’s RSS, partially, I think, because many of the processes return no output from pmap -x):
ps aux | awk '{print $2}' | grep -v PID | xargs sudo pmap -x | grep total | grep -v grep | awk '{print $3}' | awk '{s+=$1} END {printf "%.0f", s}'; echo
256820
ps_mem.py is mentioned at https://stackoverflow.com/a/133444/6090676. It inspects /proc/$pid/statm and /proc/$pid/smaps. No illumination here (again, it seems to be ignoring some processes):
# python ps_mem.py
Private  +   Shared  =  RAM used    Program

  1.7 MiB +   1.0 MiB =   2.7 MiB   apache2
  2.0 MiB +   1.0 MiB =   3.0 MiB   bash (3)
---------------------------------
                          5.7 MiB
=================================
There is another question similar to this (but with less information) at Incorrect reporting of container memory usage by cadvisor. Thanks!
回答 1:
One thing I didn’t see you check here is kernel memory. This is also accounted for in the memory.usage_in_bytes figure, but doesn’t appear in memory.stat. You can find that by looking at /sys/fs/cgroup/memory/memory.kmem.usage_in_bytes.
回答 2:
cAdvisor extract many memory-related metrics. We will focus on:
- container_memory_usage_bytes = value in
/sys/fs/cgroup/memory/memory.usage_in_bytesfile. (Usage of the memory) container_memory_working_set_bytes= container_memory_usage_bytes - total_inactive_file (from/sys/fs/cgroup/memory/memory.stat), this is calculated in cAdvisor and is <= container_memory_usage_bytes- container_memory_rss = total_rss value from
/sys/fs/cgroup/memory/memory.stat
Now you know how those metrics are gathered, you need to know that when you use the kubectl top pods command, you get the value of container_memory_working_set_bytes not container_memory_usage_bytes metric.
so from your values: 5039Mi “working set fro kubectl command” ~= 5064 “from memory.usage file” - 28 “total_inactive_file from Memory section from docker’s container stats API”
It is also worth to mention that when the value of container_memory_usage_bytes reaches to the limits, your pod will NOT get oom-killed. BUT if container_memory_working_set_bytes or container_memory_rss reached to the limits, the pod will be killed.
Q&A
How does kubernetes guarantee reliability of kube proxy and kubelet?
If Kube proxy is down, the pods on a kubernetes node will not be able to communicate with the external world. Anything that Kubernetes does specially to guarantee the reliability of kube-proxy?
Similarly, how does Kubernetes guarantee reliability of kubelet?
Answers:
It guarantees their reliability by:
-
Having multiple nodes: If one
kubeletcrashes, one node goes down. Similarly, every node runs akube-proxyinstance, which means losing one node means losing thekube-proxyinstance on that node. Kubernetes is designed to handle node failures. And if you designed your app that is running on Kubernetes to be scalable, you will not be running it as single instance but rather as multiple instances - andkube-schedulerwill distribute your workload across multiple nodes - which means your application will still be accessible. -
Supporting a Highly-Available Setup: If you set up your Kubernetes cluster in High-Availability mode properly, there won’t be one master node, but multiple. This means, you can even tolerate losing some master nodes. The managed Kubernetes offerings of the cloud providers are always highly-available.
These are the first 2 things that come to my mind. However, this is a broad question, so I can go into details if you elaborate what you mean by “reliability” a bit.
How to stop/pause a pod in kubernetes
I have a MySQL pod running in my cluster.
I need to temporarily pause the pod from working without deleting it, something similar to docker where the docker stop container-id cmd will stop the container not delete the container. Are there any commands available in kubernetes to pause/stop a pod?
Answers:
So, like others have pointed out, Kubernetes doesn’t support stop/pause of current state of pod and resume when needed. However, you can still achieve it by having no working deployments which is setting number of replicas to 0.
kubectl scale --replicas=0 deployment/<your-deployment>
see the help
# Set a new size for a Deployment, ReplicaSet, Replication Controller, or StatefulSet.
kubectl scale --help
Scale also allows users to specify one or more preconditions for the scale action.
If –current-replicas or –resource-version is specified, it is validated before the scale is attempted, and it is guaranteed that the precondition holds true when the scale is sent to the server.
Examples:
# Scale a replicaset named 'foo' to 3.
kubectl scale --replicas=3 rs/foo

# Scale a resource identified by type and name specified in "foo.yaml" to 3.
kubectl scale --replicas=3 -f foo.yaml

# If the deployment named mysql's current size is 2, scale mysql to 3.
kubectl scale --current-replicas=2 --replicas=3 deployment/mysql

# Scale multiple replication controllers.
kubectl scale --replicas=5 rc/foo rc/bar rc/baz

# Scale statefulset named 'web' to 3.
kubectl scale --replicas=3 statefulset/web
如果也可以使用删除操作:
With Kubernets, it’s not possible to stop/pause a Pod. However, you can delete a Pod, given the fact you have the manifest to bring that back again.
If you want to delete a Pod, you can run the following kubectl command:
kubectl delete -n default pod <your-pod-name>
Refer
- Kubernetes 官网
- https://kubernetes.io/zh-cn/docs/concepts/
- Kubernetes 和 Mesos 有啥区别,我该使用哪个好?
- Setting the right requests and limits in Kubernetes