OpenTelemetry in Action
- What is OTLP?
- 术语
- History
- What is OpenTelemetry?
- OpenTelemetry Concepts
- Glossary
- The OpenTelemetry C++ Client
- Refer
故障定位,本质是一个信息检索的问题。
Observability has come a long way from the days of juggling a mix of proprietary tools and dealing with vendor lock-in. Today, the OpenTelemetry Protocol (OTLP) is leading the charge with its unified, vendor-neutral approach.
OpenTelemetry, also known as OTel, is a vendor-neutral open source Observability framework for instrumenting, generating, collecting, and exporting telemetry data such as traces, metrics, and logs.
As an industry-standard, OpenTelemetry is supported by more than 40 observability vendors, integrated by many libraries, services, and apps, and adopted by numerous end users.

What is OTLP?
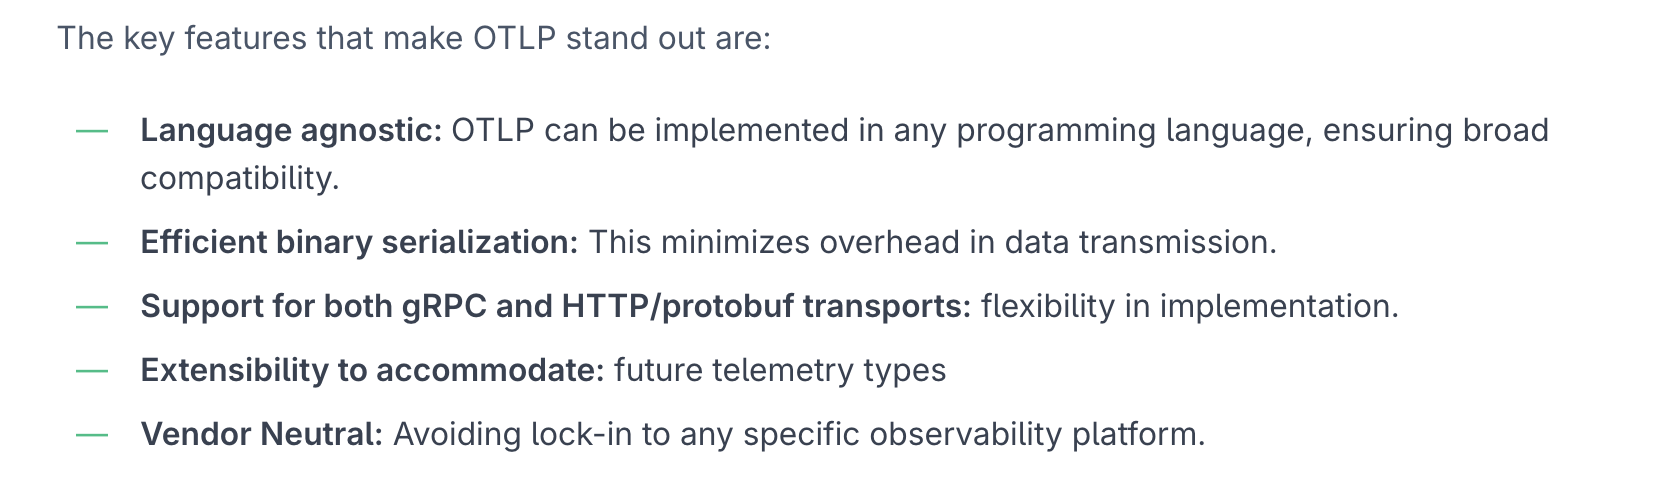
OTLP is the standardized protocol for transmitting telemetry data in OpenTelemetry. It defines how traces, metrics, and logs are serialized and transported from your applications to backends or other components in your observability pipeline.
术语
指标和维度
-
指标(
Metrics) 是用于衡量事物发展程度的单位或方法。它们通常是数值型数据,可以通过加和、平均等汇总计算方式得到。指标需要在一定的前提条件进行汇总计算,如时间、地点、范围,这些前提条件也称为统计口径与范围。一般是坐标系中的纵坐标,比如 CPU 使用率、在线人数等。 指标也有不同的类型区别,具体可查看指标类型。 -
维度(
Dimensions) 是事物或现象的某种特征,如性别、地区、时间等都是维度。根据维度所对应的数据类型不同,维度可以分为定性维度和定量维度。维度的值一般都是可枚举的字符串,维度的组合不宜过多,影响数据的存储和查询使用。 -
P50(平均耗时)、P95 耗时、P99 耗时:统计学概念,将所有数值从小到大排序后,有 x% 的值是小于 Px 的值。例如:比如 99% 的数据,都小于 P99 这个值。
维度基数
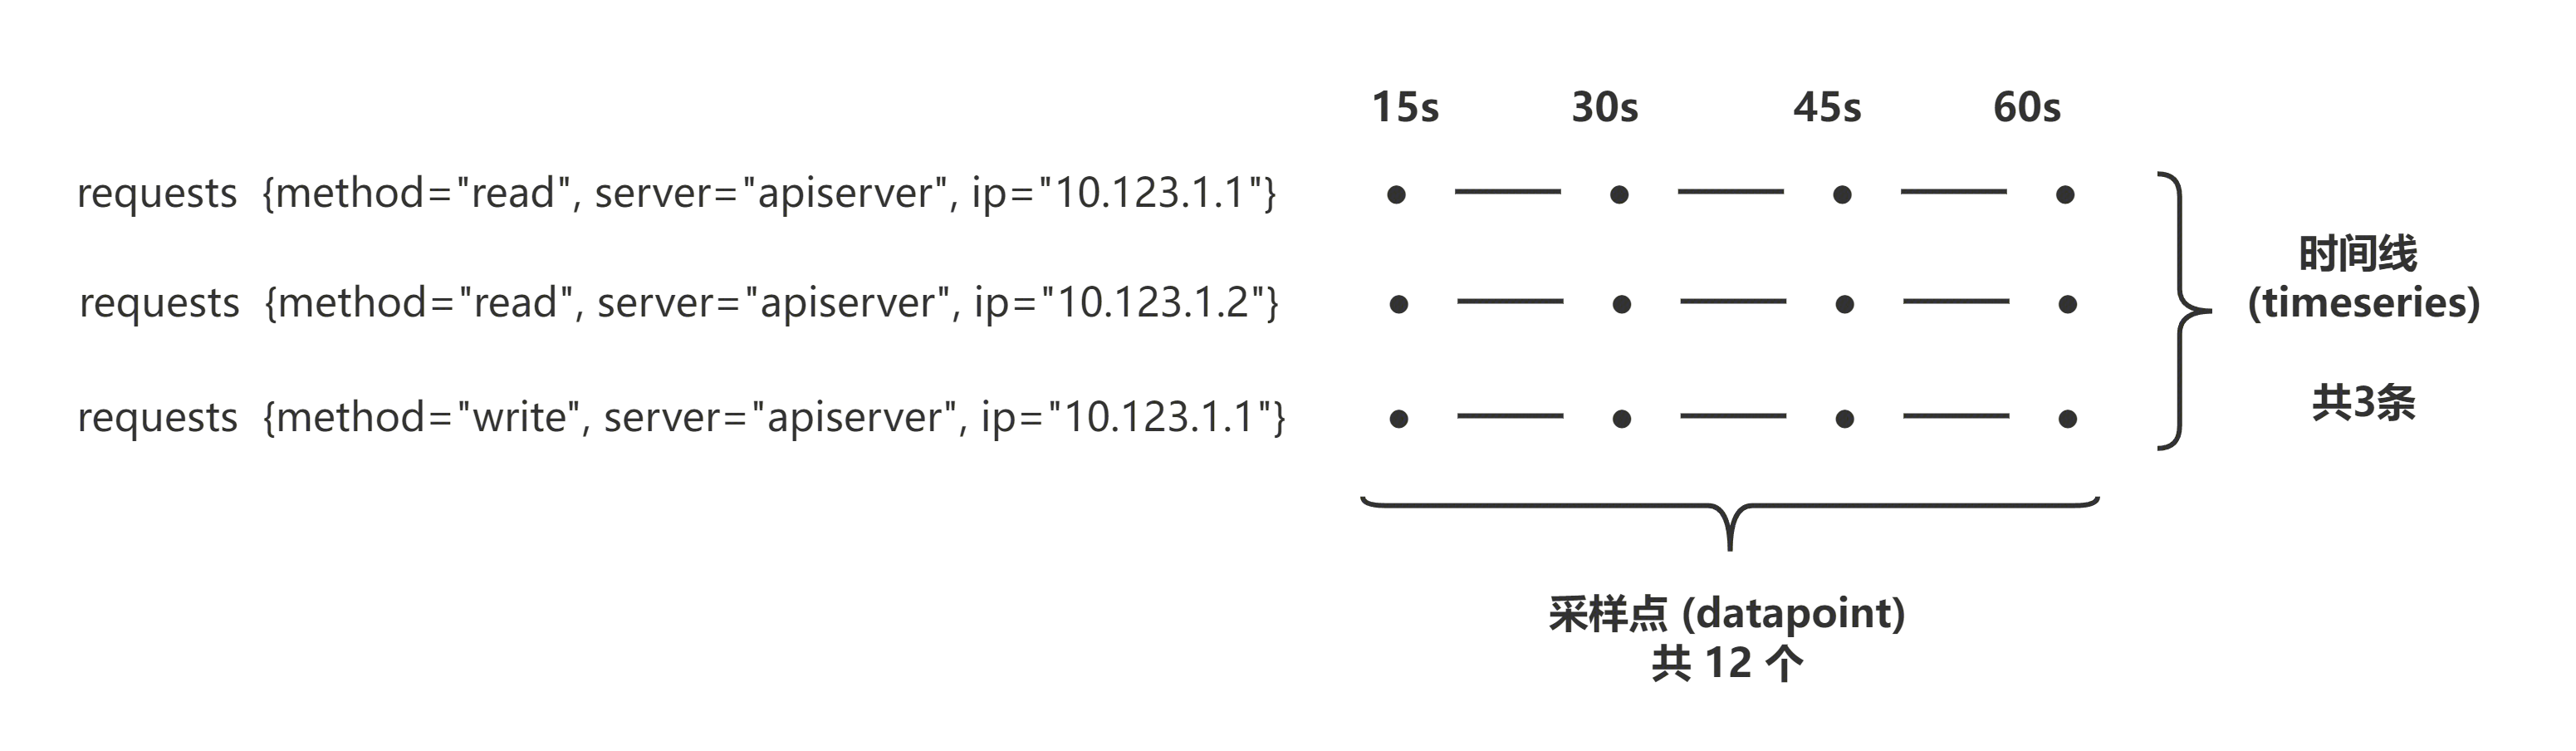
在指标领域,维度基数指的是所有维度组合的个数,也叫时间线个数。更多介绍:基数:时间序列和标签
假如:某服务,服务名叫 apiserver,其对外提供 2 个接口,分别为 read 和 write,服务部署在 3 台机器上,IP 分别为 10.123.1.1, 10.123.1.2, 10.123.1.3。假如要统计该服务的请求量指标 requests,且需要分接口和机器的请求量数据。则对应的维度基数 (时间线个数) 为:服务名个数 * 接口个数 * 机器个数 = 1 * 2 * 3 = 6。所以,如果关注 IP 维度的数据,服务在未变更的情况下,扩容操作会导致数据量大幅增长。
| 服务名 | 接口名 | IP |
|---|---|---|
| apiserver | read | 10.123.1.1 |
| apiserver | read | 10.123.1.2 |
| apiserver | read | 10.123.1.3 |
| apiserver | write | 10.123.1.1 |
| apiserver | write | 10.123.1.2 |
| apiserver | write | 10.123.1.3 |
采样点
维度基数(时间线个数)和采样点的关系:
Trace & Span
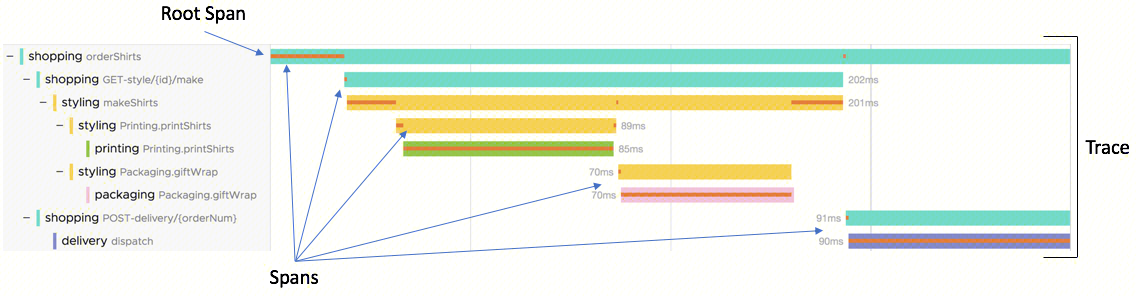
Trace:记录经过分布式系统的请求活动,一个 Trace 是 Spans 的有向无环图 (DAG)。Span:Span 嵌套形成 Trace 树。每个 Trace 包含一个根 Span,描述了端到端的延迟,其子操作也可能拥有一个或多个子 Span。
常用指标类型
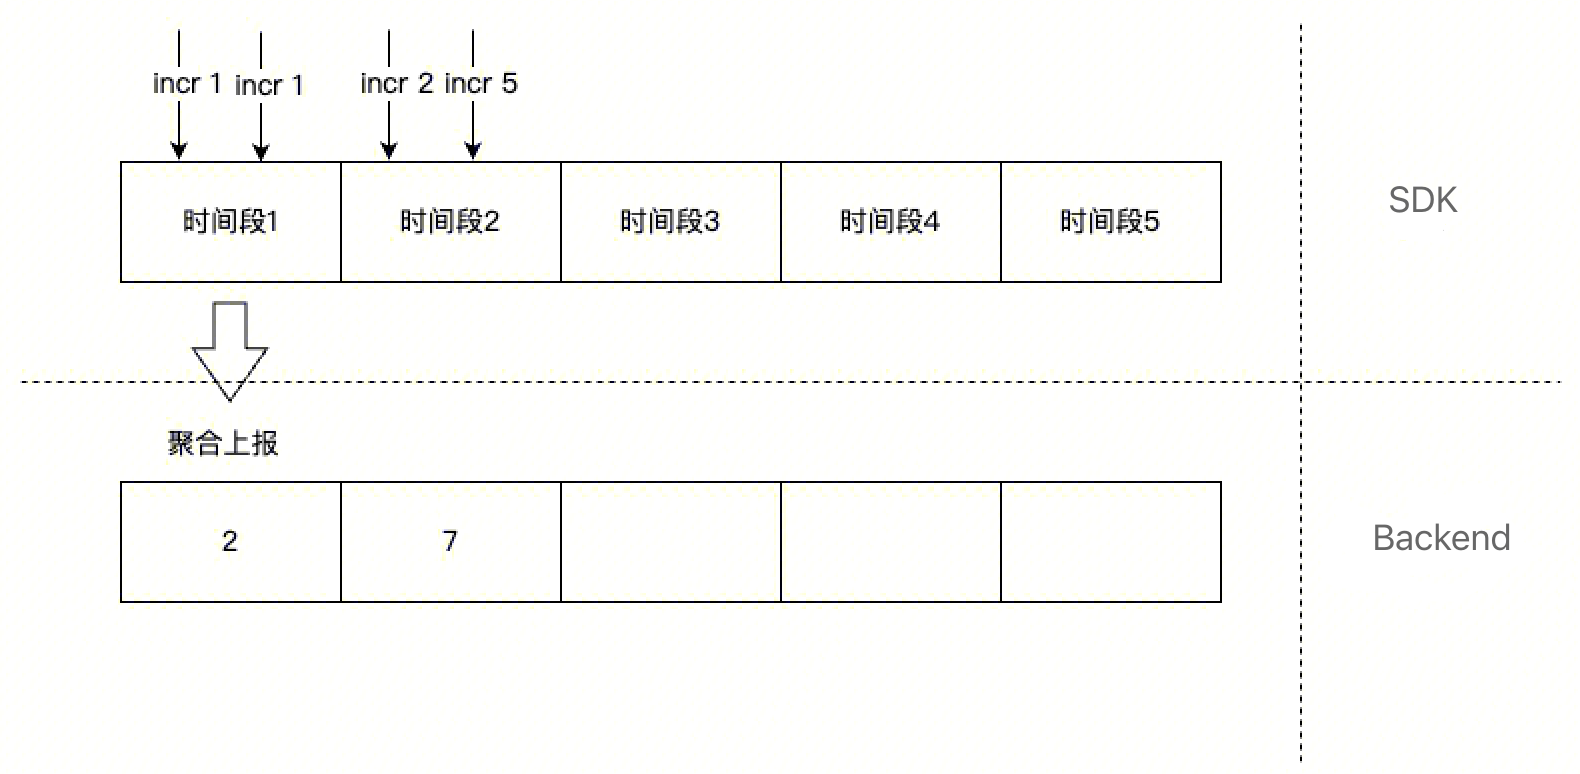
Counter
Counter 就是个计数器,一般用于统计累积量,累积一定时间后,SDK 会把累加的数据值一次性上报,上报完以后计数器清零,重新再累加。Counter 对应 Sum 聚合方式。使用场景:统计调用量,成功量,失败量等。
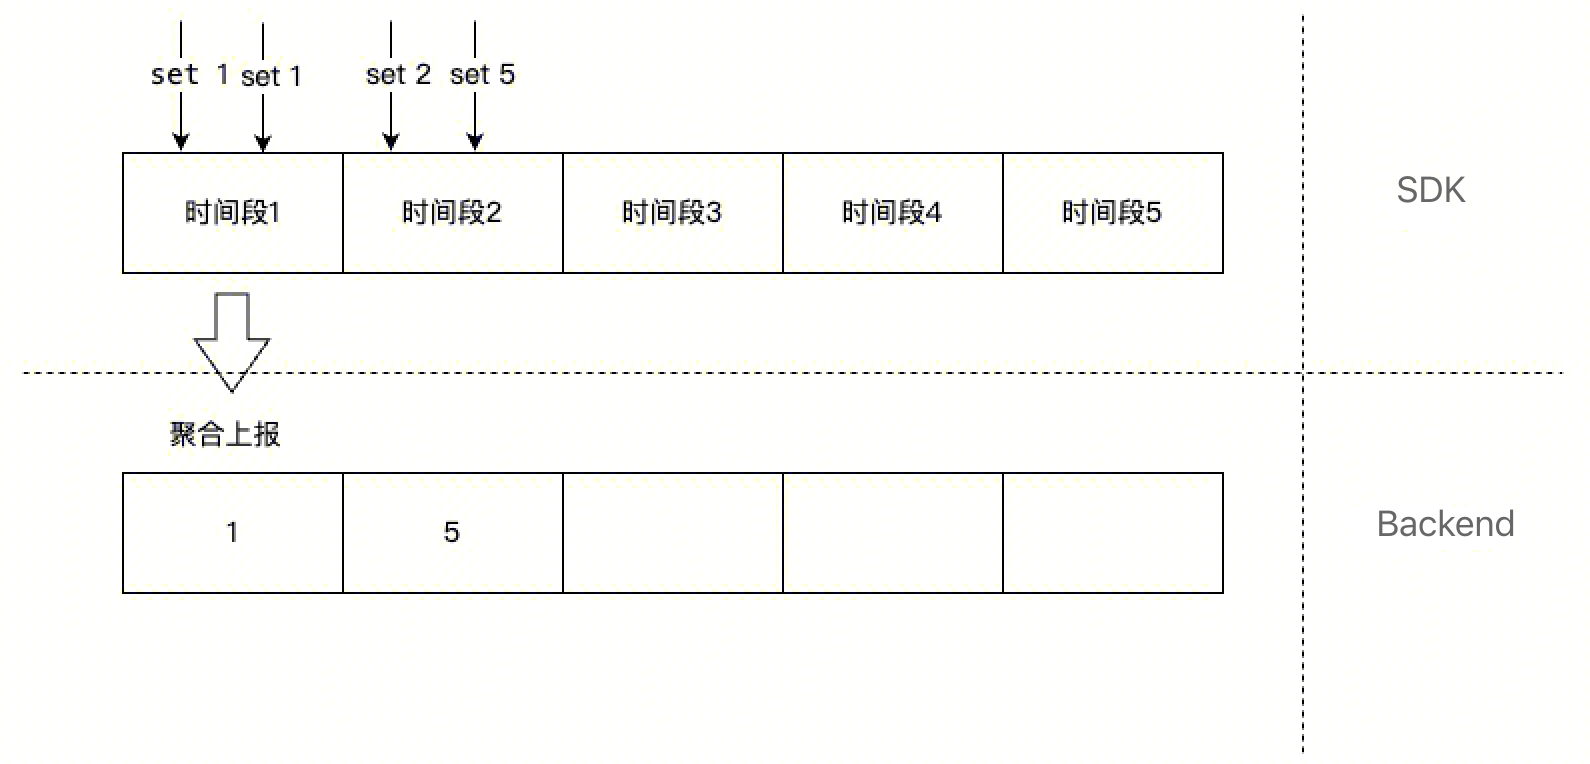
Gauge (测量仪器 /ɡeɪdʒ/)
Gauge 就是一个瞬时值,一般用于统计时刻量。Gauge 对应 Set 聚合方式。使用场景:CPU 使用率,内存使用率等。
Timer
Timer 是根据一个操作的开始时间、结束时间,统计某个操作的耗时情况。单位是秒。
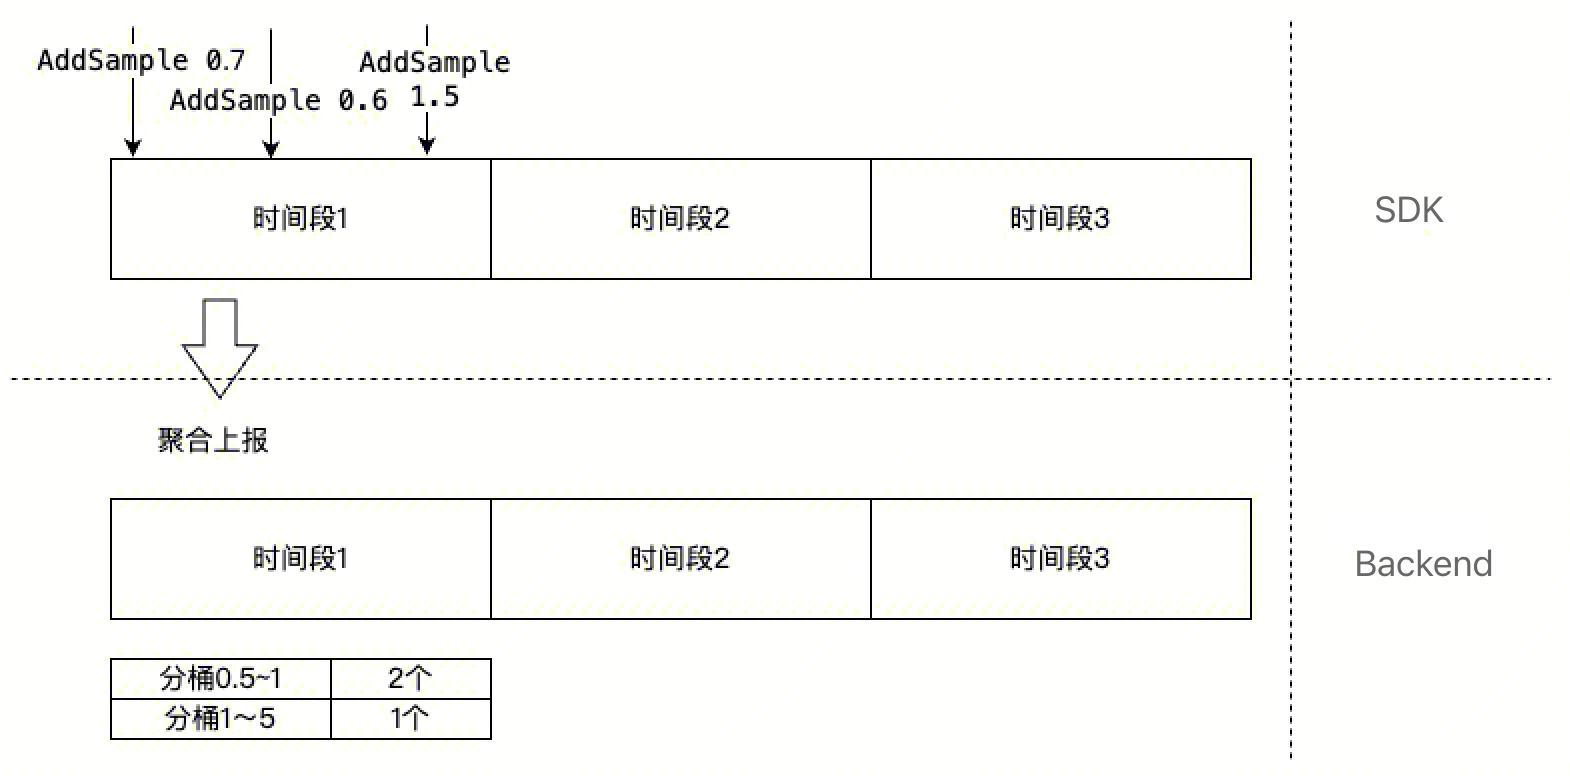
Histogram (柱状图 /ˈhɪstəɡræm/)
Histogram 是根据预先划分好的 buckets (桶),将收集到的样本点放入到对应的 bucket 中,这样就方便查看不同区间(bucket 的上下界)的样本数量、平均值、最大值、最小值等。
请根据数据分布情况合理配置分桶,一般参考平均值,分桶覆盖均线上下,合理的分桶会使分位置计算更准确。
History
OpenTelemetry is a Cloud Native Computing Foundation (CNCF) project that is the result of a merger between two prior projects, OpenTracing and OpenCensus. Both of these projects were created to solve the same problem: the lack of a standard for how to instrument code and send telemetry data to an Observability backend. As neither project was fully able to solve the problem independently, they merged to form OpenTelemetry and combine their strengths while offering a single solution.
If you are currently using OpenTracing or OpenCensus, you can learn how to migrate to OpenTelemetry in the Migration guide.
What is OpenTelemetry?
A short explanation of what OpenTelemetry is and isn’t.
OpenTelemetry is an Observability framework and toolkit designed to create and manage telemetry data such as traces, metrics, and logs. Crucially, OpenTelemetry is vendor- and tool-agnostic, meaning that it can be used with a broad variety of Observability backends, including open source tools like Jaeger and Prometheus, as well as commercial offerings.
OpenTelemetry is not an observability backend like Jaeger, Prometheus, or other commercial vendors. OpenTelemetry is focused on the generation, collection, management, and export of telemetry. A major goal of OpenTelemetry is that you can easily instrument your applications or systems, no matter their language, infrastructure, or runtime environment. Crucially, the storage and visualization of telemetry is intentionally left to other tools.
OpenTelemetry(OTel)是一个由云原生计算基金会(CNCF)开发和维护的开源可观测性框架,旨在提供一个统一、跨语言的可观测性平台。它专注于遥测数据的生成、收集、管理和导出,但不负责存储和可视化这些数据。
OpenTelemetry 的主要目标是使应用程序或系统无论采用何种编程语言、基础设施或运行时环境,都可以轻松地进行仪表化。这意味着开发者可以使用 OpenTelemetry 来检测、生成、收集和导出遥测数据,如链路追踪(traces)、度量(metrics)和日志(logs),而无需担心具体的技术细节。
OpenTelemetry 并不是一个可观测性后端,例如 Jaeger、Prometheus 等。相反,它提供了一套标准化的数据模型和工具,以便将遥测数据发送到各种后端系统进行存储和分析。例如,Jaeger 可以用于分布式追踪的存储和分析,而 Prometheus 则擅长时间序列度量的收集和告警。
此外,OpenTelemetry 支持多种导出器,允许将遥测数据导出到不同的后端系统,包括开源工具和商业产品。这使得用户可以根据自己的需求选择合适的存储和可视化工具,从而实现灵活的可观测性解决方案。
总之,OpenTelemetry 是一个强大的可观测性框架,通过标准化遥测数据的生成和管理,帮助开发者在各种环境中实现高效的应用监控和分析。然而,其核心功能仅限于数据的生成和导出,而具体的存储和可视化则需要借助其他工具来完成.
What is observability?
Observability is the ability to understand the internal state of a system by examining its outputs. In the context of software, this means being able to understand the internal state of a system by examining its telemetry data, which includes traces, metrics, and logs.
To make a system observable, it must be instrumented (仪表化的). That is, the code must emit traces, metrics, or logs. The instrumented data must then be sent to an observability backend.
Why OpenTelemetry?
With the rise of cloud computing, microservices architectures, and increasingly complex business requirements, the need for software and infrastructure observability is greater than ever.
OpenTelemetry satisfies the need for observability while following two key principles:
- You own the data that you generate. There’s no vendor lock-in.
- You only have to learn a single set of APIs and conventions.
Both principles combined grant teams and organizations the flexibility they need in today’s modern computing world.
If you want to learn more, take a look at OpenTelemetry’s mission, vision, and values.
Main OpenTelemetry components
OpenTelemetry consists of the following major components:
- A specification for all components
- A standard protocol that defines the shape of telemetry data
- Semantic conventions that define a standard naming scheme for common telemetry data types
- APIs that define how to generate telemetry data
- Language SDKs that implement the specification, APIs, and export of telemetry data
- A library ecosystem that implements instrumentation for common libraries and frameworks
- Automatic instrumentation components that generate telemetry data without requiring code changes
- The OpenTelemetry Collector, a proxy that receives, processes, and exports telemetry data
- Various other tools, such as the OpenTelemetry Operator for Kubernetes, OpenTelemetry Helm Charts, and community assets for FaaS
OpenTelemetry is used by a wide variety of libraries, services and apps that have OpenTelemetry integrated to provide observability by default.
OpenTelemetry is supported by numerous vendors, many of whom provide commercial support for OpenTelemetry and contribute to the project directly.
Extensibility
OpenTelemetry is designed to be extensible. Some examples of how it can be extended include:
- Adding a receiver to the OpenTelemetry Collector to support telemetry data from a custom source
- Loading custom instrumentation libraries into an SDK
- Creating a distribution of an SDK or the Collector tailored to a specific use case
- Creating a new exporter for a custom backend that doesn’t yet support the OpenTelemetry protocol (OTLP)
- Creating a custom propagator for a nonstandard context propagation format
Although most users might not need to extend OpenTelemetry, the project is designed to make it possible at nearly every level.
OpenTelemetry Concepts
Key concepts in OpenTelemetry
This section covers data sources and key components of the OpenTelemetry project, which can help you understand how OpenTelemetry works.
Observability primer
Core observability concepts.
What is Observability?
Observability lets you understand a system from the outside by letting you ask questions about that system without knowing its inner workings. Furthermore, it allows you to easily troubleshoot and handle novel problems, that is, “unknown unknowns”. It also helps you answer the question “Why is this happening?”
To ask those questions about your system, your application must be properly instrumented. That is, the application code must emit signals such as traces, metrics, and logs. An application is properly instrumented when developers don’t need to add more instrumentation to troubleshoot an issue, because they have all of the information they need.
OpenTelemetry is the mechanism by which application code is instrumented to help make a system observable.
Reliability and metrics
Telemetry (遥测技术) refers to data emitted from a system and its behavior. The data can come in the form of traces, metrics, and logs.
Reliability (可靠性) answers the question: “Is the service doing what users expect it to be doing?” A system could be up 100% of the time, but if, when a user clicks “Add to Cart” to add a black pair of shoes to their shopping cart, the system doesn’t always add black shoes, then the system could be unreliable.
Metrics (指标) are aggregations over a period of time of numeric data about your infrastructure or application. Examples include: system error rate, CPU utilization, and request rate for a given service. For more on metrics and how they relate to OpenTelemetry, see Metrics.
Service Level Indicator (SLI, 服务水平指标), represents a measurement of a service’s behavior. A good SLI measures your service from the perspective of your users. An example SLI can be the speed at which a web page loads.
SLI(服务水平指标,Service Level Indicator)是用于衡量服务性能和质量的特定指标。它提供客观数据,帮助评估服务是否达到了其定义的目标和目标。SLI通常基于服务的具体方面来定义,例如可用性、响应时间和吞吐量等。
一个良好的SLI应从用户的角度出发,以确保其能够反映用户的实际体验。例如,网页加载速度就是一个典型的SLI,因为它直接关联到用户体验。此外,SLI必须是可测量的、与业务目标一致,并且能够准确描述服务质量。
总之,SLI是衡量服务质量的重要工具,通过从用户视角出发定义合理的指标,可以更好地理解和改进服务性能。
Service Level Objective (SLO, 服务级别目标), represents the means by which reliability is communicated to an organization/other teams. This is accomplished by attaching one or more SLIs to business value.
服务级别目标(Service Level Objective,简称SLO)是向组织或其他团队传达可靠性的手段。这是通过将一个或多个服务水平指标(Service Level Indicator,简称SLI)附加到业务价值上来实现的。
Understanding distributed tracing
Distributed tracing lets you observe requests as they propagate(传播) through complex, distributed systems. Distributed tracing improves the visibility of your application or system’s health and lets you debug behavior that is difficult to reproduce locally. It is essential for distributed systems, which commonly have nondeterministic problems or are too complicated to reproduce locally.
To understand distributed tracing, you need to understand the role of each of its components: logs, spans, and traces.
Logs (日志)
A log is a timestamped message emitted by services or other components. Unlike traces, they aren’t necessarily associated with any particular user request or transaction. You can find logs almost everywhere in software. Logs have been heavily relied on in the past by both developers and operators to help them understand system behavior.
Sample log:
I, [2021-02-23T13:26:23.505892 #22473] INFO -- : [6459ffe1-ea53-4044-aaa3-bf902868f730] Started GET "/" for ::1 at 2021-02-23 13:26:23 -0800
Logs aren’t enough for tracking code execution, as they usually lack contextual information, such as where they were called from.
They become far more useful when they are included as part of a span, or when they are correlated with a trace and a span.
For more on logs and how they pertain to OpenTelemetry, see Logs.
Spans (时间跨度)
A span represents a unit of work or operation. Spans track specific operations that a request makes, painting a picture of what happened during the time in which that operation was executed.
A span contains name, time-related data, structured log messages, and other metadata (that is, Attributes) to provide information about the operation it tracks.
Span attributes
Span attributes are metadata attached to a span.
The following table contains examples of span attributes:
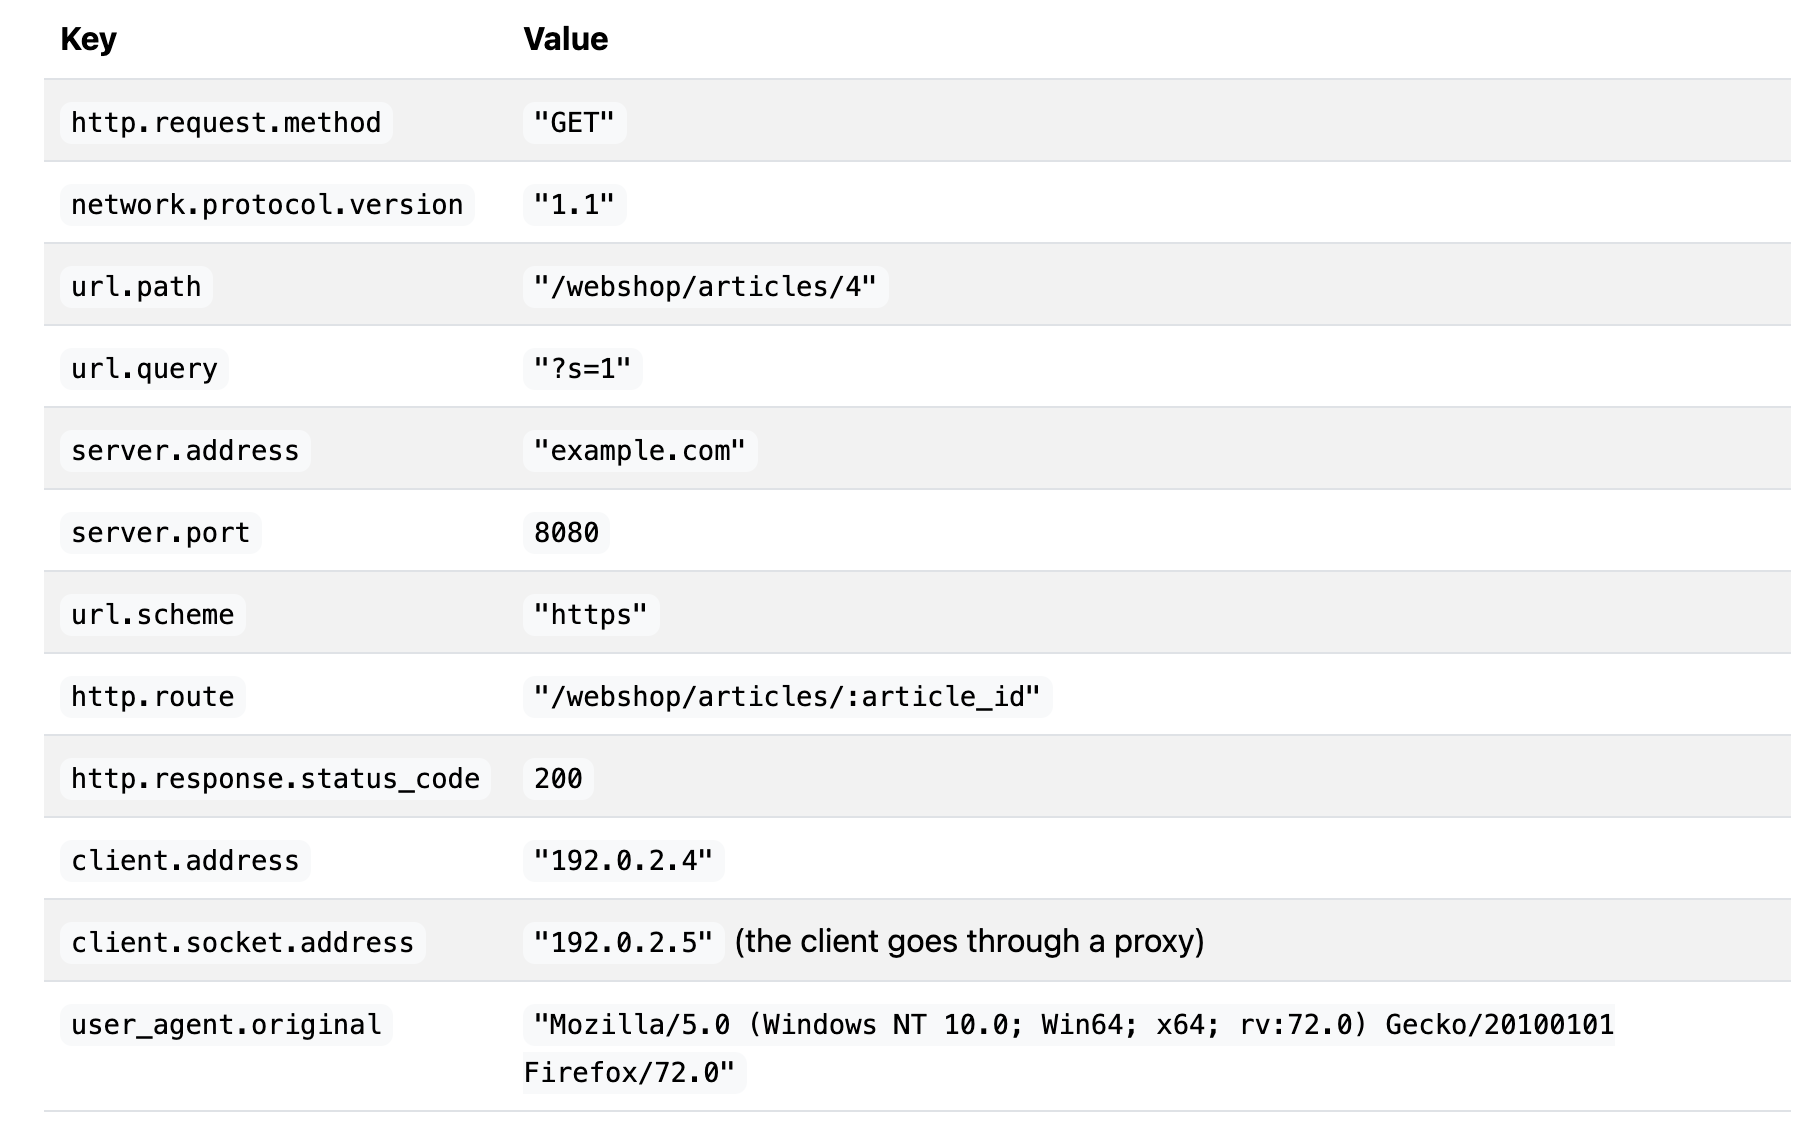
For more on spans and how they relate to OpenTelemetry, see Spans.
Distributed traces (跟踪)
A distributed trace, more commonly known as a trace, records the paths taken by requests (made by an application or end-user) as they propagate through multi-service architectures, like microservice and serverless applications.
A trace is made of one or more spans. The first span represents the root span. Each root span represents a request from start to finish. The spans underneath the parent provide a more in-depth context of what occurs during a request (or what steps make up a request).
Without tracing, finding the root cause of performance problems in a distributed system can be challenging. Tracing makes debugging and understanding distributed systems less daunting by breaking down what happens within a request as it flows through a distributed system.
Many Observability backends visualize traces as waterfall diagrams (瀑布图) that look like this:
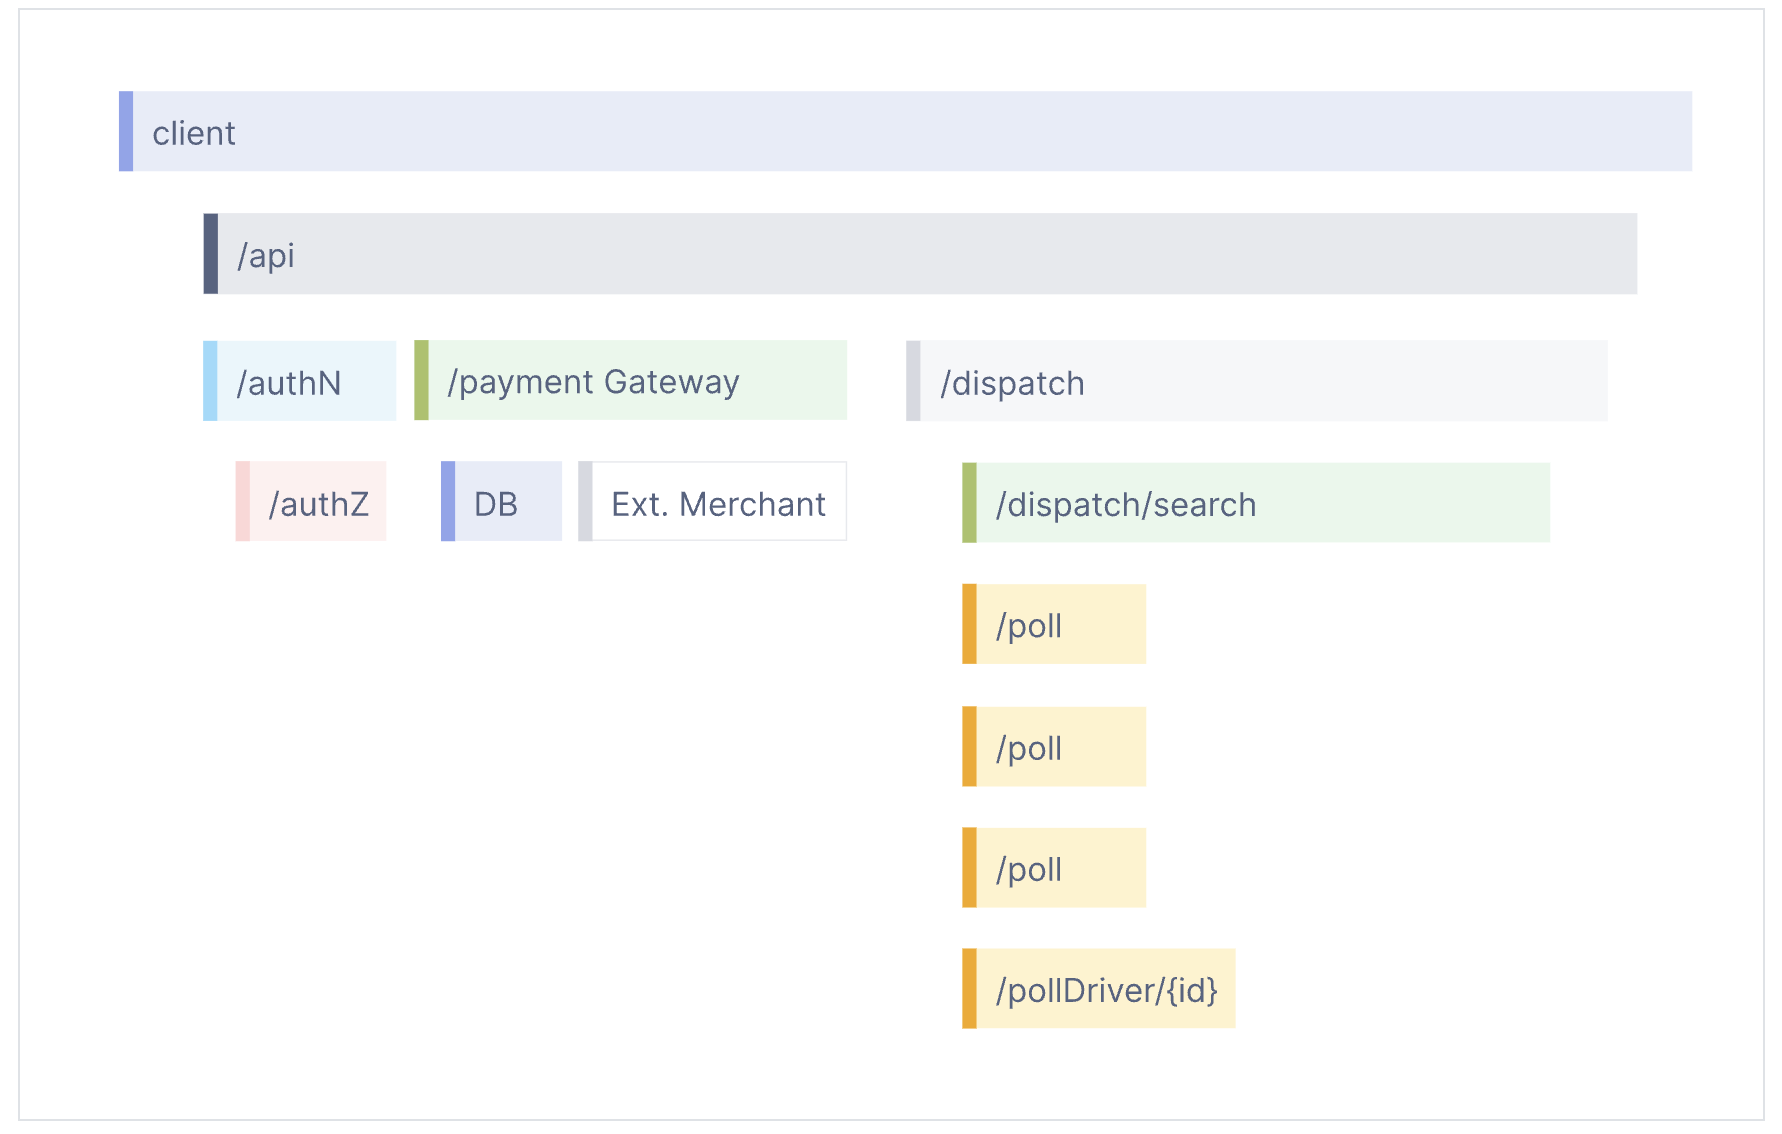
Waterfall diagrams show the parent-child relationship between a root span and its child spans. When a span encapsulates another span, this also represents a nested relationship.
For more on traces and how they pertain to OpenTelemetry, see Traces.
Context propagation
With context propagation, Signals can be correlated with each other, regardless of where they are generated. Although not limited to tracing, context propagation allows traces to build causal information about a system across services that are arbitrarily distributed across process and network boundaries.
To understand context propagation, you need to understand two separate concepts: context and propagation.
Context
Context is an object that contains the information for the sending and receiving service, or execution unit, to correlate one signal with another.
For example, if service A calls service B, then a span from service A whose ID is in context will be used as the parent span for the next span created in service B. The trace ID that is in context will be used for the next span created in service B as well, which means that the span is part of the same trace as the span from service A.
Propagation
Propagation is the mechanism that moves context between services and processes. It serializes or deserializes the context object and provides the relevant information to be propagated from one service to another.
Propagation is usually handled by instrumentation libraries and is transparent to the user. In the event that you need to manually propagate context, you can use the Propagators API.
OpenTelemetry maintains several official propagators. The default propagator is using the headers specified by the W3C TraceContext specification.
Specification
To learn more about Context Propagation, see the Context specification.
Signals
The purpose of OpenTelemetry is to collect, process, and export signals. Signals are system outputs that describe the underlying activity of the operating system and applications running on a platform. A signal can be something you want to measure at a specific point in time, like temperature or memory usage, or an event that goes through the components of your distributed system that you’d like to trace. You can group different signals together to observe the inner workings of the same piece of technology under different angles.
OpenTelemetry currently supports traces, metrics, logs and baggage. Events are a specific type of log, and profiles are being worked on by the Profiling Working Group.
Traces
The path of a request through your application.
Traces give us the big picture of what happens when a request is made to an application. Whether your application is a monolith with a single database or a sophisticated mesh of services, traces are essential to understanding the full “path” a request takes in your application.
Let’s explore this with three units of work, represented as Spans:
Note
The following JSON examples do not represent a specific format, and especially not OTLP/JSON, which is more verbose.
hello span:
{
  "name": "hello",
  "context": {
    "trace_id": "0x5b8aa5a2d2c872e8321cf37308d69df2",
    "span_id": "0x051581bf3cb55c13"
  },
  "parent_id": null,
  "start_time": "2022-04-29T18:52:58.114201Z",
  "end_time": "2022-04-29T18:52:58.114687Z",
  "attributes": {
    "http.route": "some_route1"
  },
  "events": [
    {
      "name": "Guten Tag!",
      "timestamp": "2022-04-29T18:52:58.114561Z",
      "attributes": {
        "event_attributes": 1
      }
    }
  ]
}
This is the root span, denoting the beginning and end of the entire operation. Note that it has a trace_id field indicating the trace, but has no parent_id. That’s how you know it’s the root span.
hello-greetings span:
{
  "name": "hello-greetings",
  "context": {
    "trace_id": "0x5b8aa5a2d2c872e8321cf37308d69df2",
    "span_id": "0x5fb397be34d26b51"
  },
  "parent_id": "0x051581bf3cb55c13",
  "start_time": "2022-04-29T18:52:58.114304Z",
  "end_time": "2022-04-29T22:52:58.114561Z",
  "attributes": {
    "http.route": "some_route2"
  },
  "events": [
    {
      "name": "hey there!",
      "timestamp": "2022-04-29T18:52:58.114561Z",
      "attributes": {
        "event_attributes": 1
      }
    },
    {
      "name": "bye now!",
      "timestamp": "2022-04-29T18:52:58.114585Z",
      "attributes": {
        "event_attributes": 1
      }
    }
  ]
}
This span encapsulates specific tasks, like saying greetings, and its parent is the hello span. Note that it shares the same trace_id as the root span, indicating it’s a part of the same trace. Additionally, it has a parent_id that matches the span_id of the hello span.
hello-salutations span:
{
  "name": "hello-salutations",
  "context": {
    "trace_id": "0x5b8aa5a2d2c872e8321cf37308d69df2",
    "span_id": "0x93564f51e1abe1c2"
  },
  "parent_id": "0x051581bf3cb55c13",
  "start_time": "2022-04-29T18:52:58.114492Z",
  "end_time": "2022-04-29T18:52:58.114631Z",
  "attributes": {
    "http.route": "some_route3"
  },
  "events": [
    {
      "name": "hey there!",
      "timestamp": "2022-04-29T18:52:58.114561Z",
      "attributes": {
        "event_attributes": 1
      }
    }
  ]
}
This span represents the third operation in this trace and, like the previous one, it’s a child of the hello span. That also makes it a sibling of the hello-greetings span.
These three blocks of JSON all share the same trace_id, and the parent_id field represents a hierarchy. That makes it a Trace!
Another thing you’ll note is that each Span looks like a structured log. That’s because it kind of is! One way to think of Traces is that they’re a collection of structured logs with context, correlation, hierarchy, and more baked in. However, these “structured logs” can come from different processes, services, VMs, data centers, and so on. This is what allows tracing to represent an end-to-end view of any system.
To understand how tracing in OpenTelemetry works, let’s look at a list of components that will play a part in instrumenting our code.
Metrics
A measurement captured at runtime.
A metric is a measurement of a service captured at runtime. The moment of capturing a measurements is known as a metric event, which consists not only of the measurement itself, but also the time at which it was captured and associated metadata.
Application and request metrics are important indicators of availability and performance. Custom metrics can provide insights into how availability indicators impact user experience or the business. Collected data can be used to alert of an outage or trigger scheduling decisions to scale up a deployment automatically upon high demand.
To understand how metrics in OpenTelemetry works, let’s look at a list of components that will play a part in instrumenting our code.
Metric Instruments
In OpenTelemetry measurements are captured by metric instruments. A metric instrument is defined by:
- Name
- Kind
- Unit (optional)
- Description (optional)
The name, unit, and description are chosen by the developer or defined via semantic conventions for common ones like request and process metrics.
The instrument kind is one of the following:
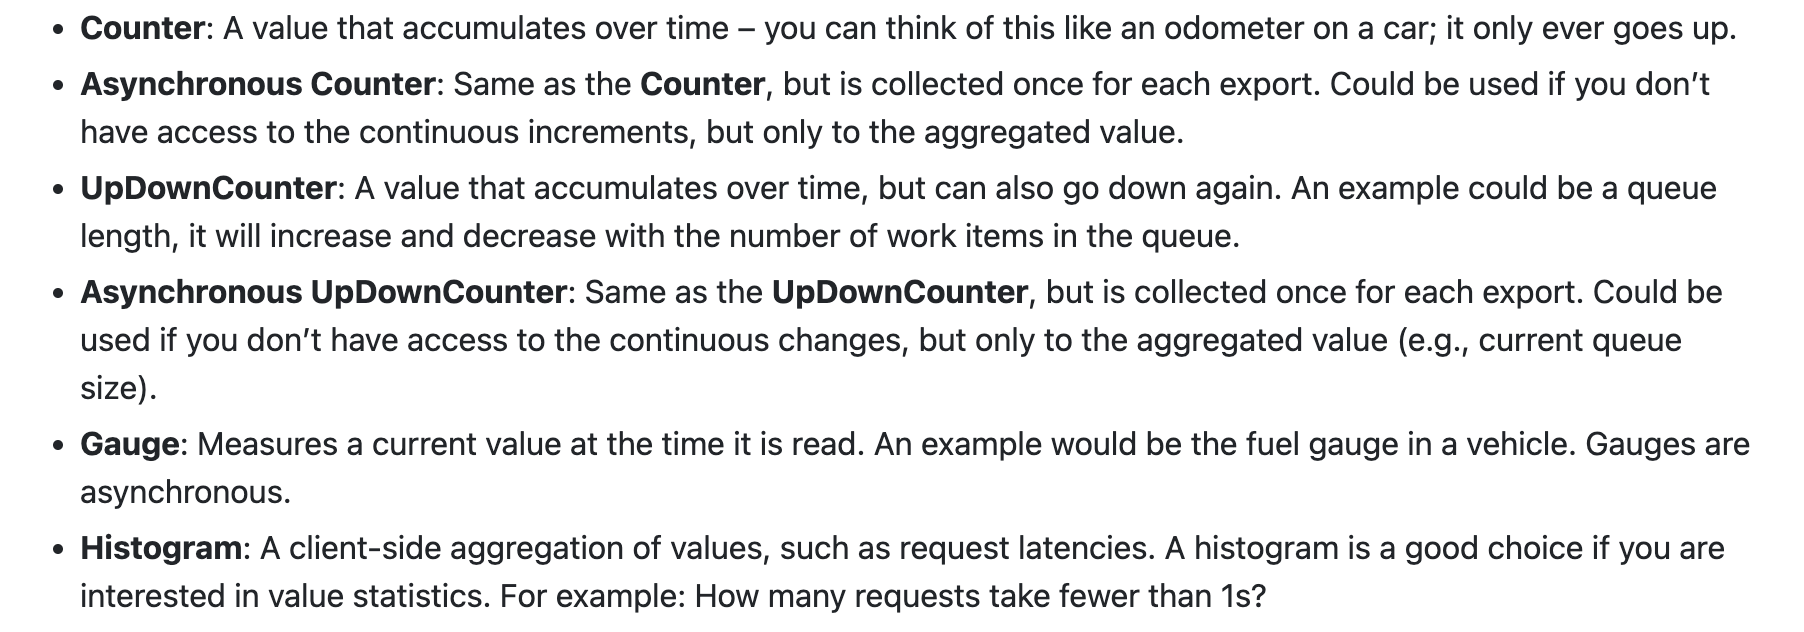
For more on synchronous and asynchronous instruments, and which kind is best suited for your use case, see Supplementary Guidelines.
Logs
A recording of an event.
A log is a timestamped text record, either structured (recommended) or unstructured, with optional metadata. Of all telemetry signals, logs have the biggest legacy. Most programming languages have built-in logging capabilities or well-known, widely used logging libraries.
OpenTelemetry logs
OpenTelemetry does not define a bespoke(定制的) API or SDK to create logs. Instead, OpenTelemetry logs are the existing logs you already have from a logging framework or infrastructure component. OpenTelemetry SDKs and autoinstrumentation utilize several components to automatically correlate logs with traces.
OpenTelemetry’s support for logs is designed to be fully compatible with what you already have, providing capabilities to wrap those logs with additional context and a common toolkit to parse and manipulate logs into a common format across many different sources.
Structured, unstructured, and semistructured logs
OpenTelemetry does not technically distinguish between structured and unstructured logs. You can use any log you have with OpenTelemetry. However, not all log formats are equally useful! Structured logs, in particular, are recommended for production observability because they are easy to parse and analyze at scale.
The following section explains the differences between structured, unstructured, and semistructured logs.
Structured logs (结构化日志)
A structured log is a log whose textual format follows a consistent, machine-readable format. For applications, one of the most common formats is JSON:
{
  "timestamp": "2024-08-04T12:34:56.789Z",
  "level": "INFO",
  "service": "user-authentication",
  "environment": "production",
  "message": "User login successful",
  "context": {
    "userId": "12345",
    "username": "johndoe",
    "ipAddress": "192.168.1.1",
    "userAgent": "Mozilla/5.0 (Windows NT 10.0; Win64; x64) AppleWebKit/537.36 (KHTML, like Gecko) Chrome/104.0.0.0 Safari/537.36"
  },
  "transactionId": "abcd-efgh-ijkl-mnop",
  "duration": 200,
  "request": {
    "method": "POST",
    "url": "/api/v1/login",
    "headers": {
      "Content-Type": "application/json",
      "Accept": "application/json"
    },
    "body": {
      "username": "johndoe",
      "password": "******"
    }
  },
  "response": {
    "statusCode": 200,
    "body": {
      "success": true,
      "token": "jwt-token-here"
    }
  }
}
and for infrastructure components, Common Log Format (CLF) is commonly used:
127.0.0.1 - johndoe [04/Aug/2024:12:34:56 -0400] "POST /api/v1/login HTTP/1.1" 200 1234
It is also common to have different structured log formats mixed together. For example, an Extended Log Format (ELF) log can mix JSON with the whitespace-separated data in a CLF log.
192.168.1.1 - johndoe [04/Aug/2024:12:34:56 -0400] "POST /api/v1/login HTTP/1.1" 200 1234 "http://example.com" "Mozilla/5.0 (Windows NT 10.0; Win64; x64) AppleWebKit/537.36 (KHTML, like Gecko) Chrome/104.0.0.0 Safari/537.36" {"transactionId": "abcd-efgh-ijkl-mnop", "responseTime": 150, "requestBody": {"username": "johndoe"}, "responseHeaders": {"Content-Type": "application/json"}}
To make the most use of this log, parse both the JSON and the ELF-related pieces into a shared format to make analysis on an observability backend easier. The filelogreceiver in the OpenTelemetry Collector contains standardized ways to parse logs like this.
Structured logs are the preferred way to use logs. Because structured logs are emitted in a consistent format, they are straightforward to parse, which makes them easier to preprocess in an OpenTelemetry Collector, correlate with other data, and ultimate analyze in an Observability backend.
Unstructured logs (无结构化日志)
Unstructured logs are logs that don’t follow a consistent structure. They may be more human-readable, and are often used in development. However, it is not preferred to use unstructured logs for production observability purposes, since they are much more difficult to parse and analyze at scale.
Examples of unstructured logs:
[ERROR] 2024-08-04 12:45:23 - Failed to connect to database. Exception: java.sql.SQLException: Timeout expired. Attempted reconnect 3 times. Server: db.example.com, Port: 5432

System reboot initiated at 2024-08-04 03:00:00 by user: admin. Reason: Scheduled maintenance. Services stopped: web-server, database, cache. Estimated downtime: 15 minutes.

DEBUG - 2024-08-04 09:30:15 - User johndoe performed action: file_upload. Filename: report_Q3_2024.pdf, Size: 2.3 MB, Duration: 5.2 seconds. Result: Success
It is possible to store and analyze Unstructured logs in production, although you may need to do substantial work to parse or otherwise pre-process them to be machine-readable. For example, the above three logs will require a regular expression to parse their timestamps and custom parsers to consistently extract the bodies of the log message. This will typically be necessary for a logging backend to know how to sort and organize the logs by timestamp. Although it’s possible to parse unstructured logs for analysis purposes, doing this may be more work than switching to structured logging, such as via a standard logging framework in your applications.
Semistructured logs (半结构化日志)
A semistructured log is a log that does use some self-consistent patterns to distinguish data so that it’s machine-readable, but may not use the same formatting and delimiters between data across different systems.
Example of a semistructured log:
2024-08-04T12:45:23Z level=ERROR service=user-authentication userId=12345 action=login message="Failed login attempt" error="Invalid password" ipAddress=192.168.1.1 userAgent="Mozilla/5.0 (Windows NT 10.0; Win64; x64) AppleWebKit/537.36 (KHTML, like Gecko) Chrome/104.0.0.0 Safari/537.36"
Although machine-readable, semistructured logs may require several different parsers to allow for analysis at scale.
Baggage (行李)
Contextual information that is passed between signals.
In OpenTelemetry, Baggage is contextual information that resides next to context. Baggage is a key-value store, which means it lets you propagate any data you like alongside context.
Baggage means you can pass data across services and processes, making it available to add to traces, metrics, or logs in those services.
Example
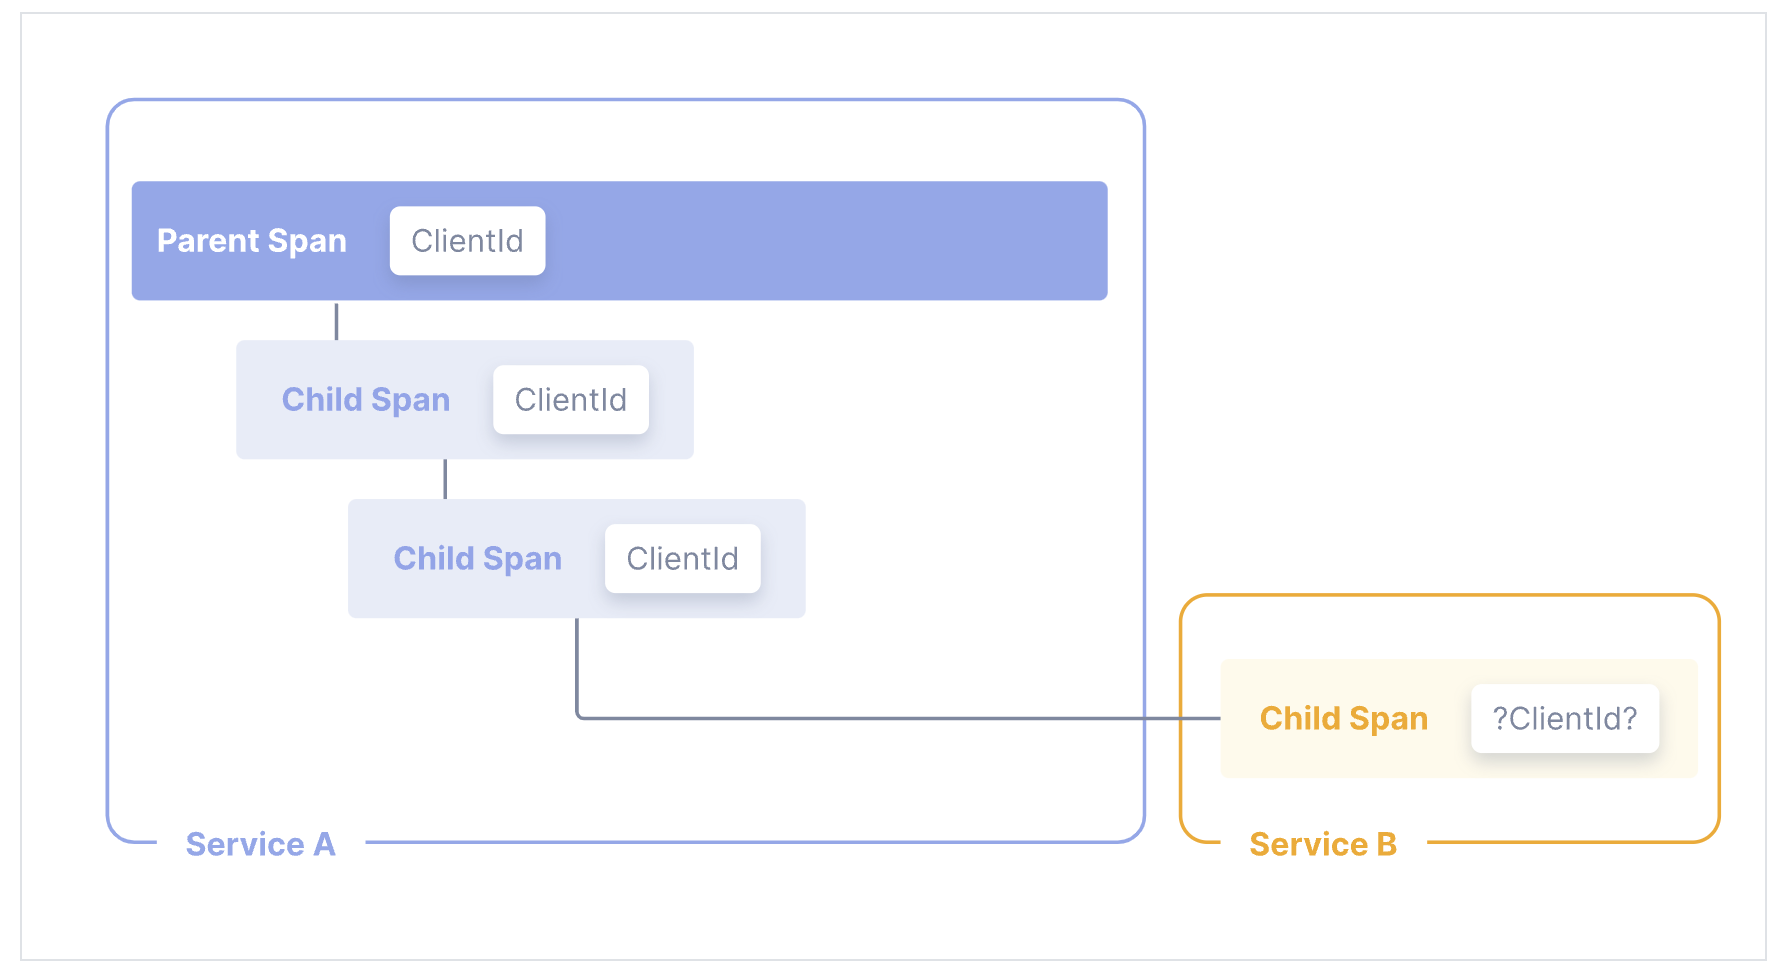
Baggage is often used in tracing to propagate additional data across services.
For example, imagine you have a clientId at the start of a request, but you’d like for that ID to be available on all spans in a trace, some metrics in another service, and some logs along the way. Because the trace may span multiple services, you need some way to propagate that data without copying the clientId across many places in your codebase.
By using Context Propagation to pass baggage across these services, the clientId is available to add to any additional spans, metrics, or logs. Additionally, instrumentations automatically propagate baggage for you.
What should OTel Baggage be used for?
Baggage is best used to include information typically available only at the start of a request further downstream. This can include things like Account Identification, User IDs, Product IDs, and origin IPs, for example.
Propagating this information using baggage allows for deeper analysis of telemetry in a backend. For example, if you include information like a User ID on a span that tracks a database call, you can much more easily answer questions like “which users are experiencing the slowest database calls?” You can also log information about a downstream operation and include that same User ID in the log data.
Instrumentation
In order to make a system observable, it must be instrumented: That is, code from the system’s components must emit traces, metrics, and logs.
Using OpenTelemetry, you can instrument your code in two primary ways:
Code-based solutions allow you to get deeper insight and rich telemetry from your application itself. They let you use the OpenTelemetry API to generate telemetry from your application, which acts as an essential complement to the telemetry generated by zero-code solutions.
Zero-code solutions are great for getting started, or when you can’t modify the application you need to get telemetry out of. They provide rich telemetry from libraries you use and/or the environment your application runs in. Another way to think of it is that they provide information about what’s happening at the edges of your application.
You can use both solutions simultaneously.
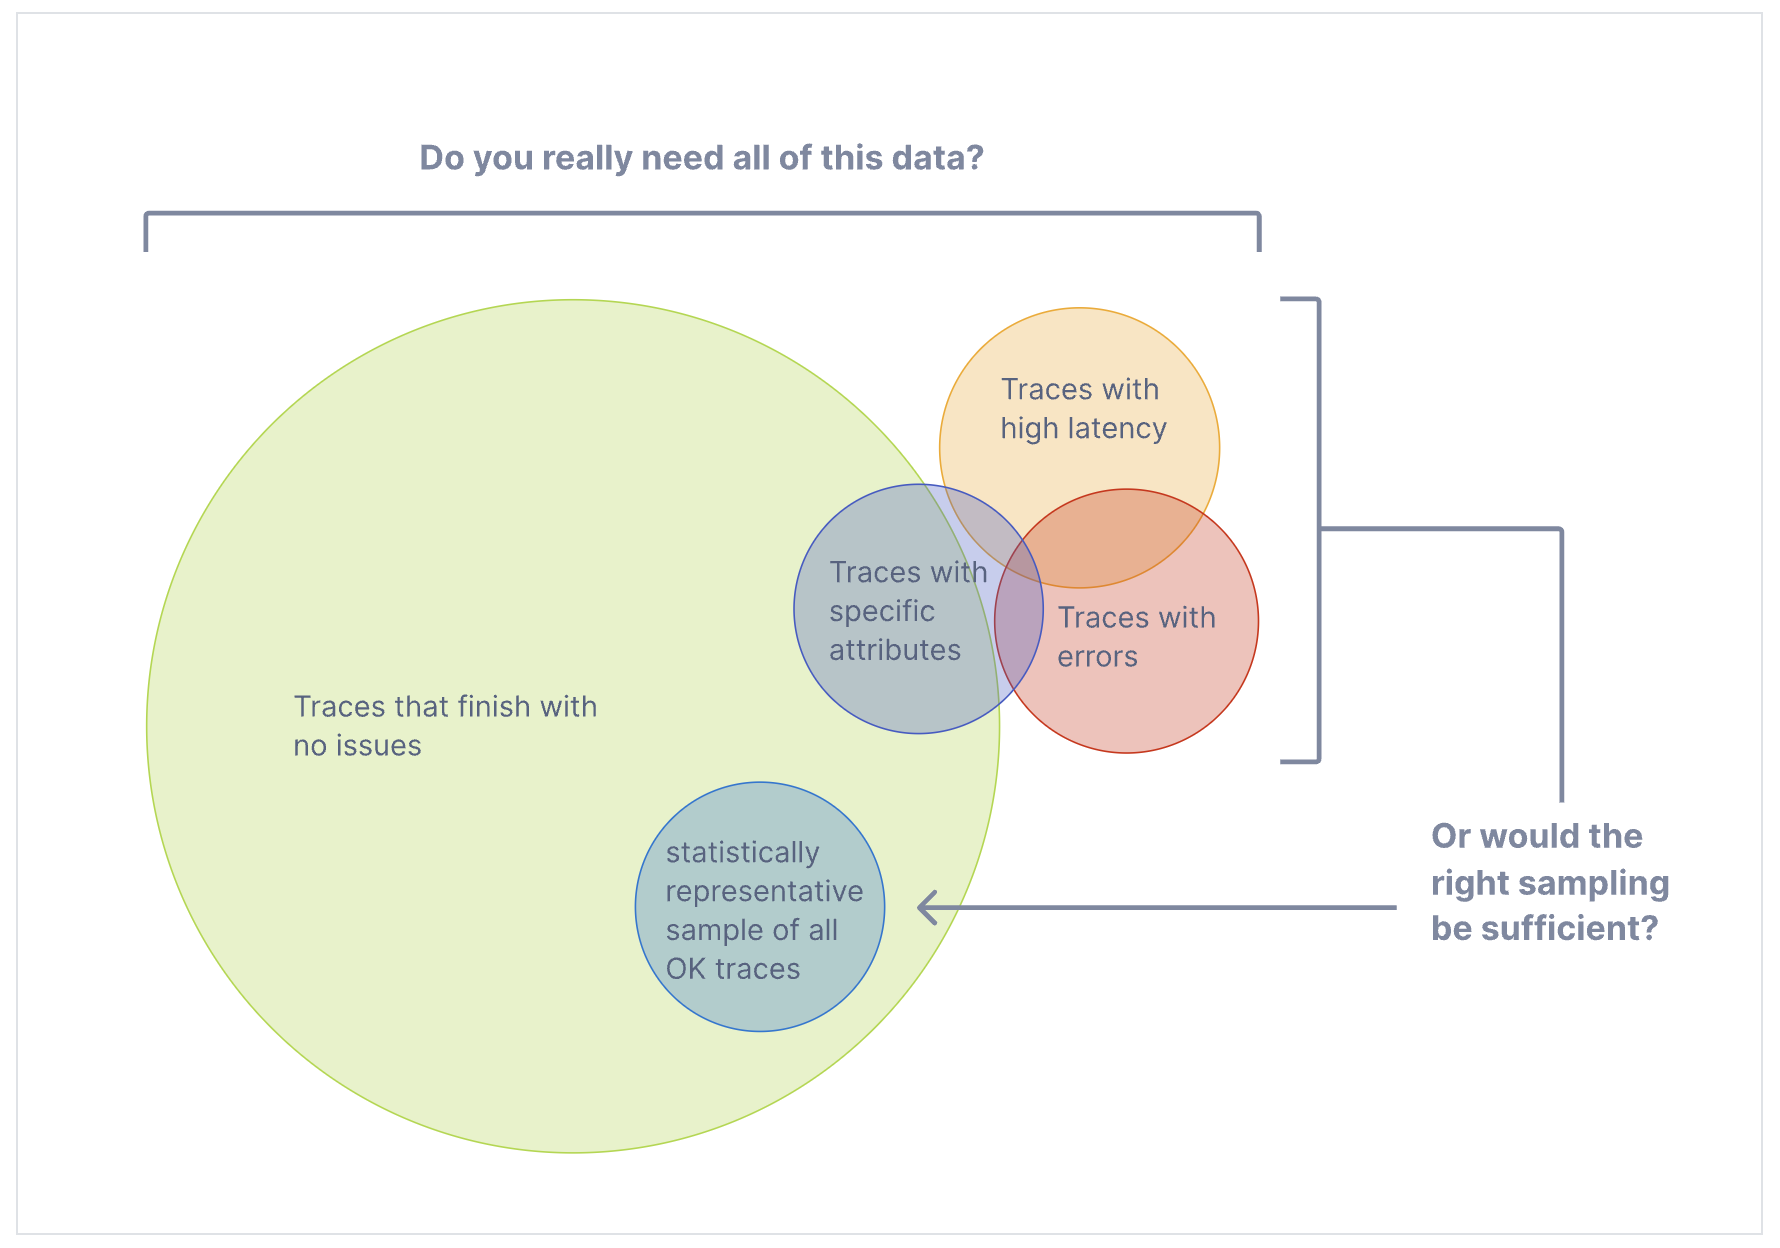
Sampling (采样)
With traces, you can observe requests as they move from one service to another in a distributed system. Tracing is highly practical for both high-level and in-depth analysis of systems.
However, if the large majority of your requests are successful and finish with acceptable latency and no errors, you do not need 100% of your traces to meaningfully observe your applications and systems. You just need the right sampling.
Terminology (术语)
It’s important to use consistent terminology when discussing sampling. A trace or span is considered “sampled” or “not sampled”:
- Sampled: A trace or span is processed and exported. Because it is chosen by the sampler as a representative of the population, it is considered “sampled”.
- Not sampled: A trace or span is not processed or exported. Because it is not chosen by the sampler, it is considered “not sampled”.
Sometimes, the definitions of these terms get mixed up. You might find someone states that they are “sampling out data” or that data not processed or exported is considered “sampled”. These are incorrect statements.
Why sampling?
Sampling is one of the most effective ways to reduce the costs of observability without losing visibility. Although there are other ways to lower costs, such as filtering or aggregating data, these other methods do not adhere to the concept of representativeness, which is crucial when performing in-depth analysis of application or system behavior.
Representativeness is the principle that a smaller group can accurately represent a larger group. Additionally, representativeness can be mathematically verified, meaning that you can have high confidence that a smaller sample of data accurately represents the larger group.
Additionally, the more data you generate, the less data you actually need to have a representative sample. For high-volume systems, is quite common for a sampling rate of 1% or lower to very accurately represent the other 99% of data.
When to sample
Consider sampling if you meet any of the following criteria(标准):
- You generate 1000 or more traces per second.
- Most of your trace data represents healthy traffic with little variation in data.
- You have some common criteria, like errors or high latency, that usually means something is wrong.
- You have domain-specific criteria you can use to determine relevant data beyond errors and latency.
- You can describe some common rules that determine if data should be sampled or dropped.
- You have a tell your services apart, so that high- and low-volume services are sampled differently.
- You have the ability to route unsampled data (for “just in case” scenarios) to low-cost storage systems.
Finally, consider your overall budget. If you have limited budget for observability, but can afford to spend time to effectively sample, then sampling can generally be worth it.
Glossary
The OpenTelemetry project uses terminology you might not be familiar with. In addition, the project defines the terminology in a different way than others. This page captures terminology used in the project and what it means.
The OpenTelemetry C++ Client
- https://github.com/open-telemetry/opentelemetry-cpp
- https://github.com/jupp0r/prometheus-cpp
Refer
- https://opentelemetry.io/docs/
- https://opentelemetry.io/docs/what-is-opentelemetry/
- Google Cloud 中的可观测性
- OpenTelemetry Protocol (OTLP): A Deep Dive into Observability
- https://last9.io/blog/opentelemetry-protocol-otlp/