Prometheus vs. VictoriaMetrics (VM)
- Prometheus
- VictoriaMetrics
- Comparing Performance
- Comparing Scalability and Integrations
- Data Compression and Storage Efficiency
- Query Language
- Ingestion Rate (摄取速率)
- High Availability and Reliability
- API
- Integration with Grafana
- Integration with Kubernetes
- Conclusion
- Refer
Comparing Prometheus vs. VictoriaMetrics (VM) - Scalability, Performance, Integrations

There are a lot of time series databases, such as Prometheus, M3DB, TimescaleDB, OpenTSDB, InfluxDB, and so on. Prometheus and VictoriaMetrics are open-source time-series databases that provide robust solutions for monitoring and alerting in complex IT environments. However, they are designed differently and offer unique features that can affect their performance, scalability, and ease of use for monitoring workloads. This article aims to analyze the differences between Prometheus and VictoriaMetrics, thus providing insight for users seeking the most suitable solution for their specific needs as a monitoring solution and observability or troubleshooting their systems.
Prometheus
Prometheus, which began as a project within SoundCloud, is a powerful monitoring and alerting toolkit built specifically for dealing with time-series data in a multi-dimensional environment. It has grown immensely popular within the SRE and DevOps community due to its native support for multidimensional data collection, querying, and alert generation.
Prometheus is developed under the Cloud Native Computing Foundation (CNCF). The Prometheus server, client libraries, Alertmanager, and other related components can be found at the Prometheus GitHub organization. The main repository is: https://github.com/prometheus/prometheus
Know more about What is Prometheus?
VictoriaMetrics
VictoriaMetrics, on the other hand, is a high-performance, cost-effective, and scalable time-series database that can be used as long-term remote storage for Prometheus. It boasts superior data compression and high-speed data ingestion, making it an appealing alternative for large-scale monitoring tasks. VictoriaMetrics source code can be found at: https://github.com/VictoriaMetrics/VictoriaMetrics
The GitHub repositories for these projects contain all the source code, docs, issues, pull requests, and documentation. These are great resources and tutorials to get started using Docker if you want to understand more about how these systems work, if you want to contribute to the projects, or if you need help troubleshooting an issue.
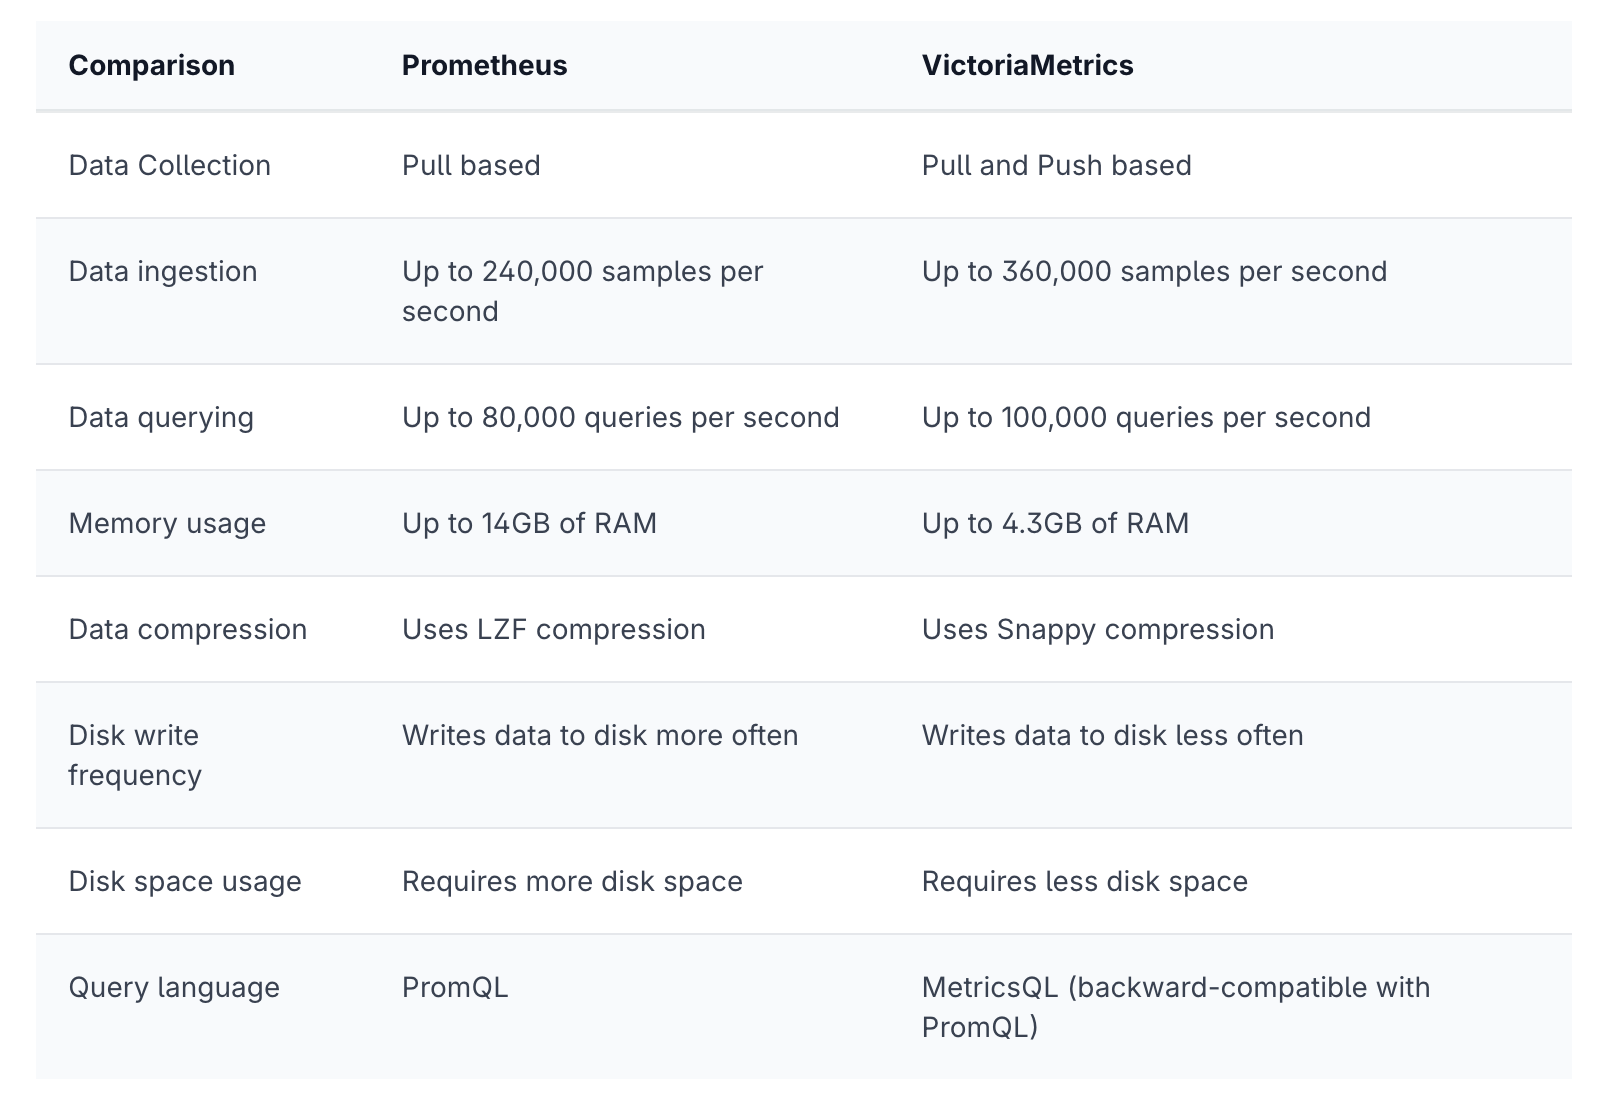
Comparing Performance
The data ingestion and querying rates performance between VictoriaMetrics vs. Prometheus are based on a benchmark test using node_exporter metrics. The memory and disk space usage figures are for a single Prometheus or VictoriaMetrics server.
Comparing Scalability and Integrations
Architecture and Scalability
Prometheus uses a pull-based model for gathering metrics, meaning it fetches metrics from the monitored systems and can handle up to millions of active time series. This architecture simplifies the deployment of monitored services. Still, managing large, dynamic environments can be challenging as it requires Prometheus instances to know the targets it needs to pull from.
VictoriaMetrics, conversely, supports both pull and push models. Its ability to handle high volumes of data and more extensive networking scenarios (thanks to its push model support) makes it scalable and flexible. It clusters natively, which simplifies long-term storage and large-scale deployments.
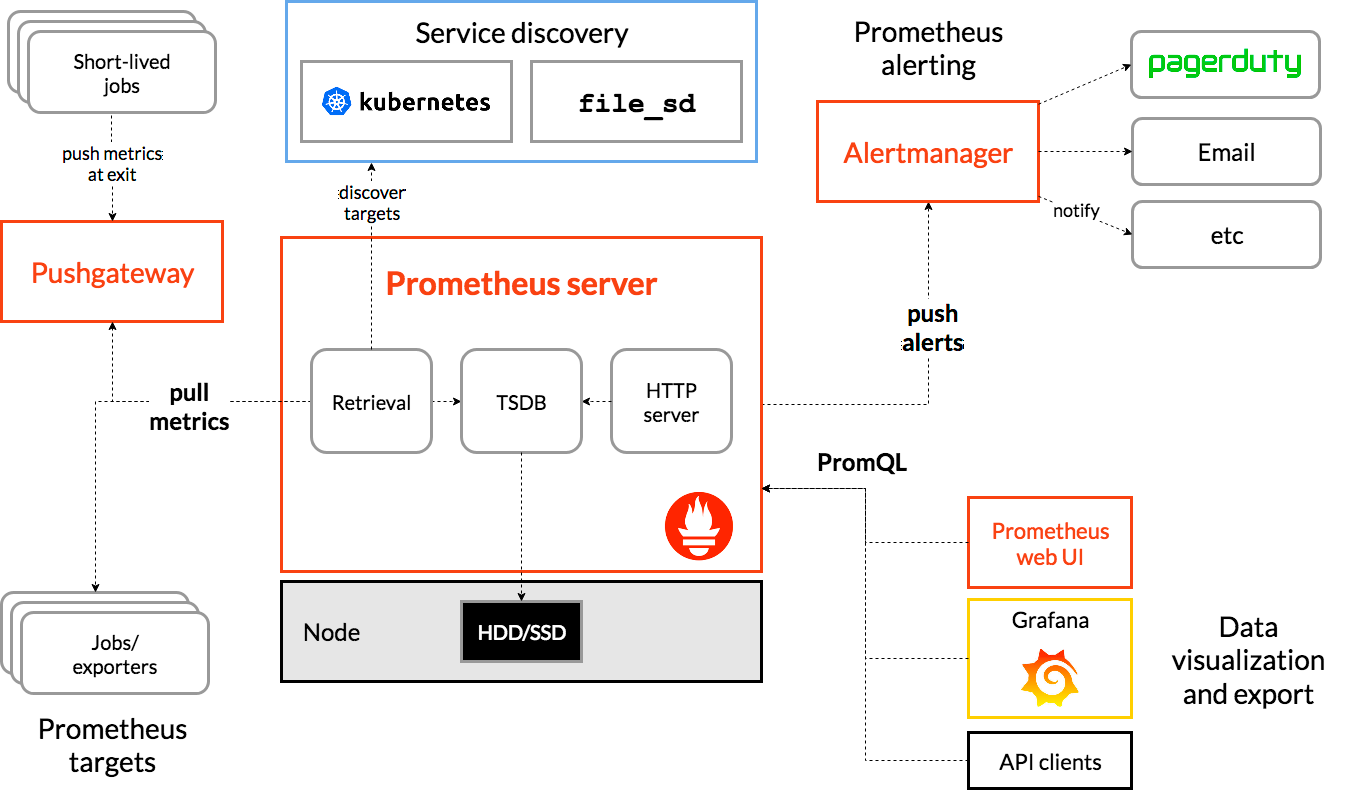
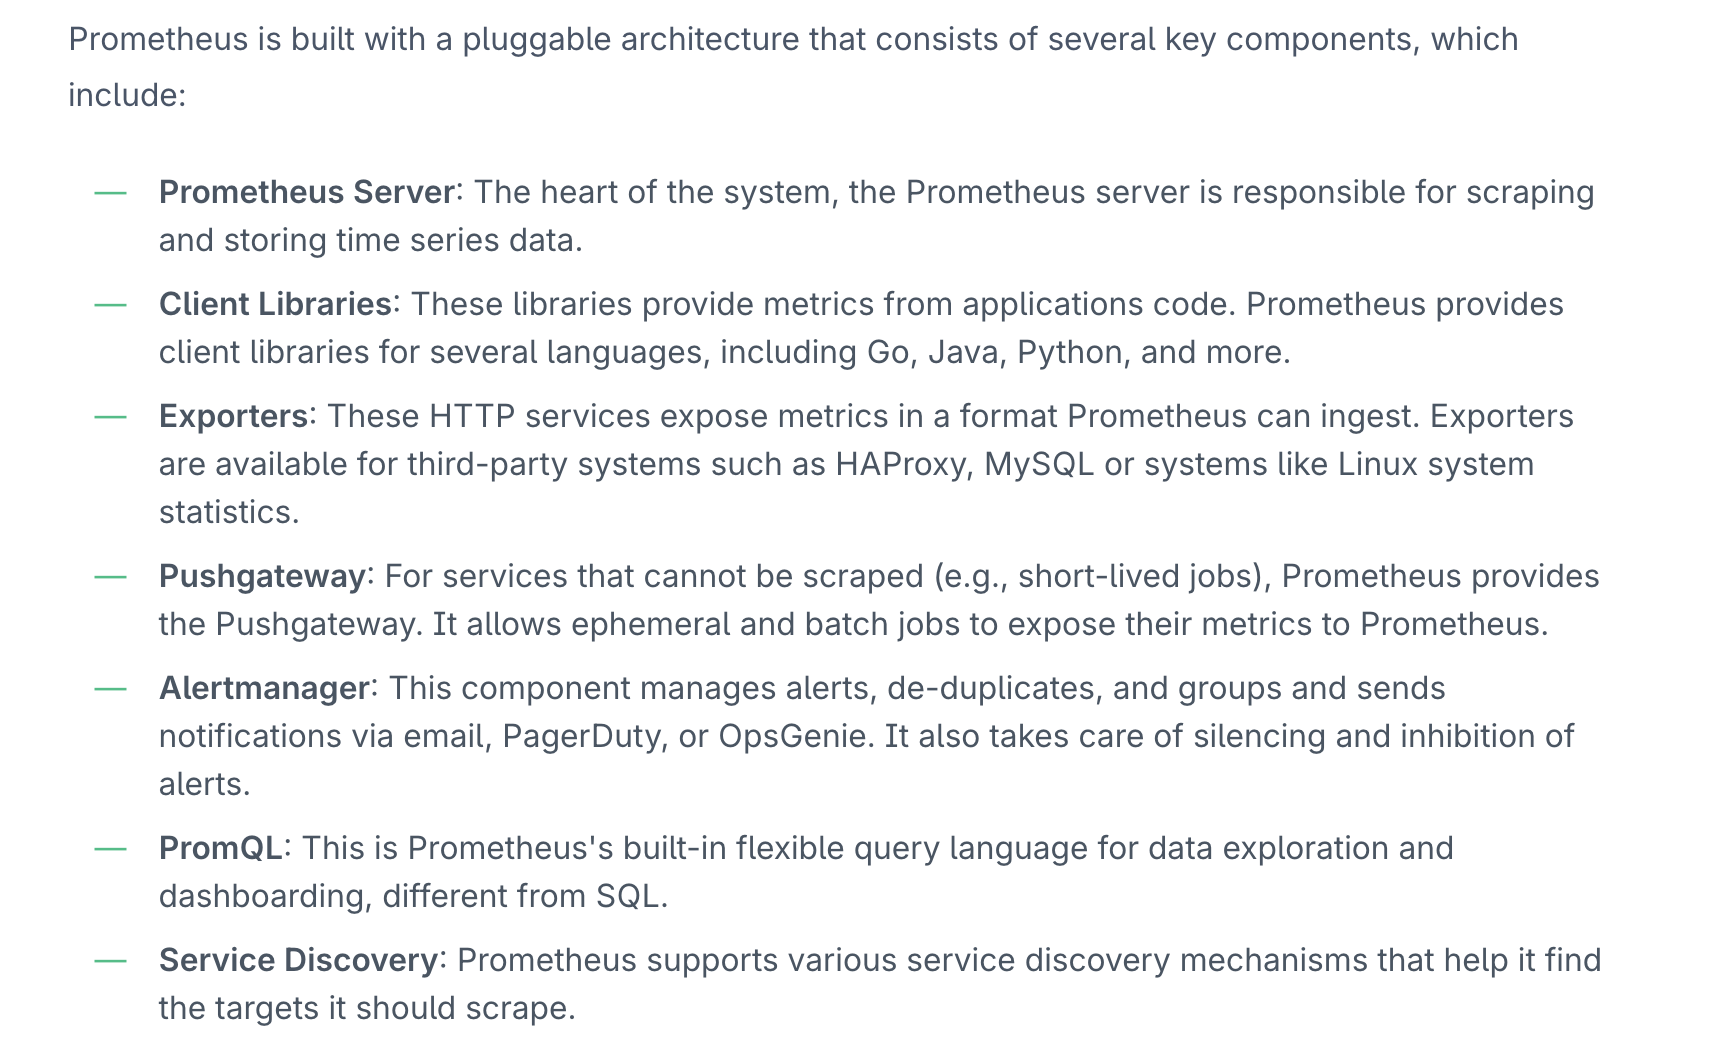
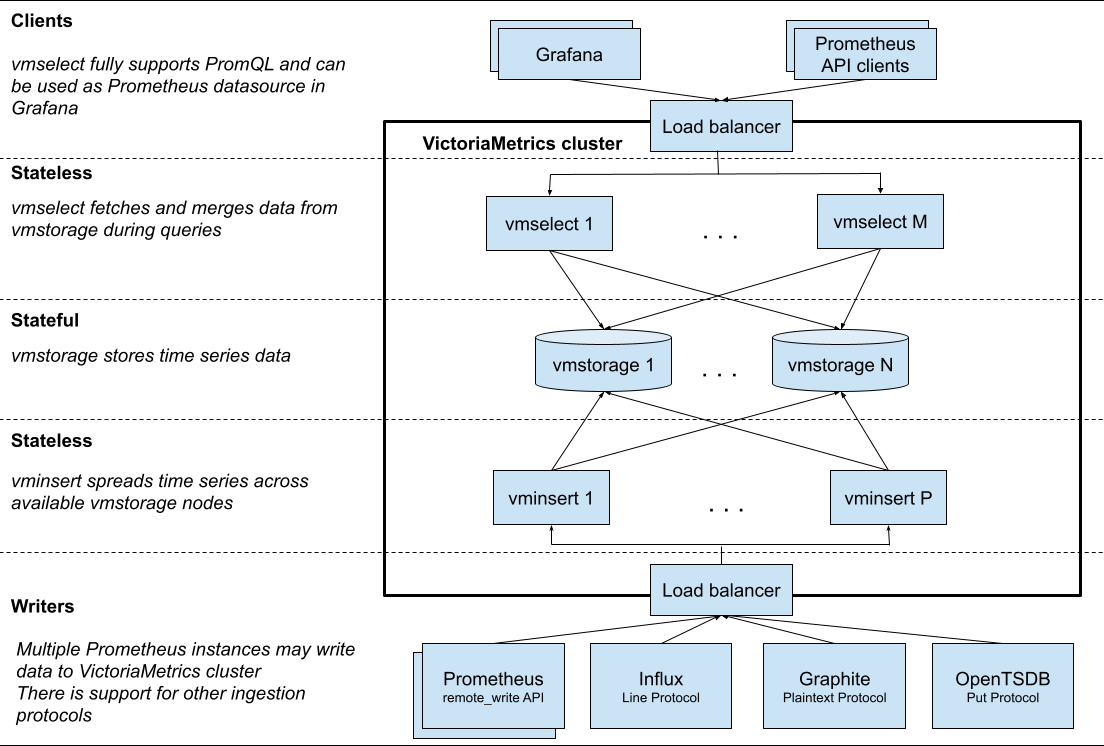
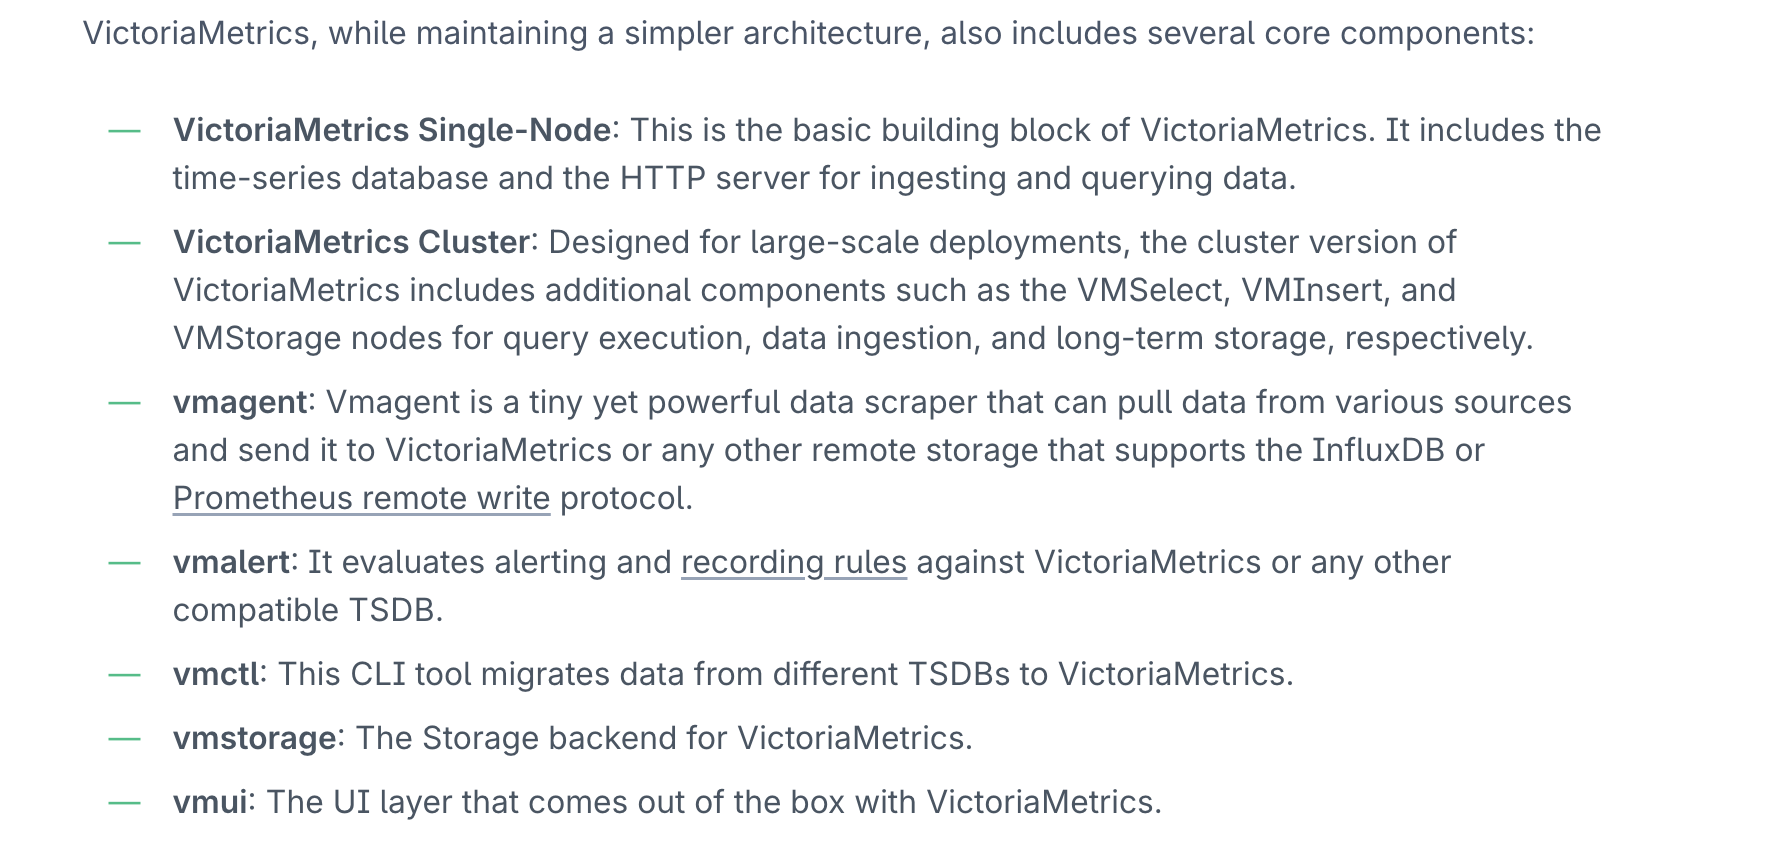
PrometheusandVictoriaMetricsare built with a component-based architecture, enabling flexible deployments and allowing each component to be independently developed, tested, and deployed.
Prometheus Architecture
VictoriaMetrics Architecture
- https://last9.io/blog/what-is-prometheus-remote-write/
- https://last9.io/blog/streaming-aggregation-vs-recording-rules/
Data Compression and Storage Efficiency
Prometheus also has an efficient storage system that doesn’t match VictoriaMetrics regarding long-term data storage backends and retrieval efficiency. There are other alternatives, such as Levitate, Thanos and Cortex, which also provide long-term retention of data.
One of VictoriaMetrics’ primary advantages over Prometheus is its data compression capabilities. It uses a more effective data compression algorithm that significantly reduces storage requirements. VictoriaMetrics claims to provide up to 10 times more data compression than Prometheus, a critical advantage for long-term data retention and cost optimization.
Levitate - a managed time series data warehouse by Last9 supports automatic data tiering, superior to Prometheus and VictoriaMetrics.
Both Prometheus and VictoriaMetrics use a combination of in-memory data handling and disk storage to manage time-series data:
Prometheus
-
In-Memory: Prometheus utilizes in-memory storage to access recent time-series data immediately. This segment of the database is known as the “head block.”
-
Disk Storage: After reaching a certain age or size, data in the head block is moved to disk in a procedure known as checkpointing real-time. This database consists of “persistent blocks” intended for longer-term storage.
Prometheus is optimized for real-time monitoring with this memory and disk storage combination. However, it isn’t designed for extensive long-term storage. Additional tools like Levitate, Thanos or Cortex are usually incorporated into the system.
VictoriaMetrics
-
In-Memory: Similar to Prometheus, VictoriaMetrics uses in-memory storage to buffer incoming data before it’s written to disk. This approach helps optimize write performance. It also caches frequently accessed data for faster retrieval.
-
Disk Storage: The bulk of the data in VictoriaMetrics is stored on disk. The system uses a space-efficient storage format that allows for significant data compression.
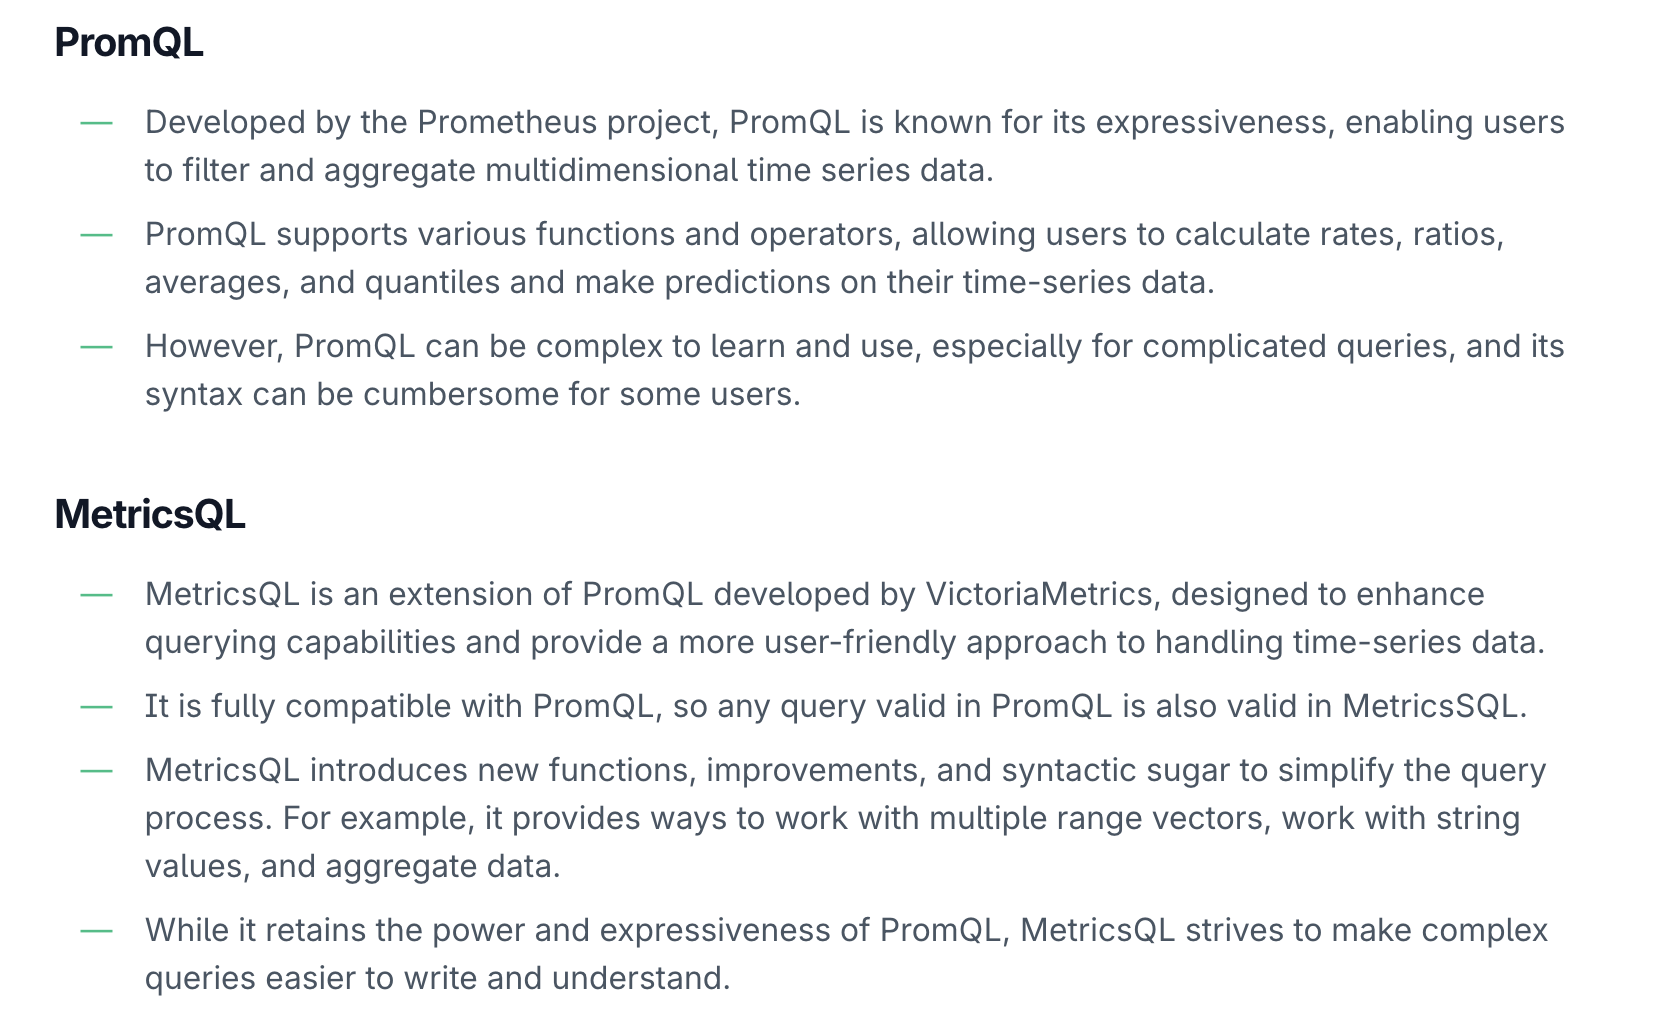
Query Language
Prometheus uses PromQL (Prometheus Query Language). PromQL allows for selecting and aggregating time series data in real-time. It enables developers to work with metrics with high flexibility. Through PromQL, users can filter and aggregate metrics, calculate rates, ratios, averages, and percentiles, and predict trends. Once mastered, it’s a very expressive language that allows users to perform complex queries to gather meaningful data from their metrics.
Levitate is fully compatible with open standards such as OpenMetrics, PromQL and OpenTelemetry.
VictoriaMetrics, on the other hand, is backward compatible with PromQL. It can run any query that is valid in PromQL. However, it also introduces an extension of PromQL called MetricsQL. MetricsQL is designed to enhance the query capabilities provided by PromQL. It introduces new functions, operators, and syntactic sugar. It simplifies and improves the user experience, especially for complex queries and aggregations.
Here are the primary differences between the two:
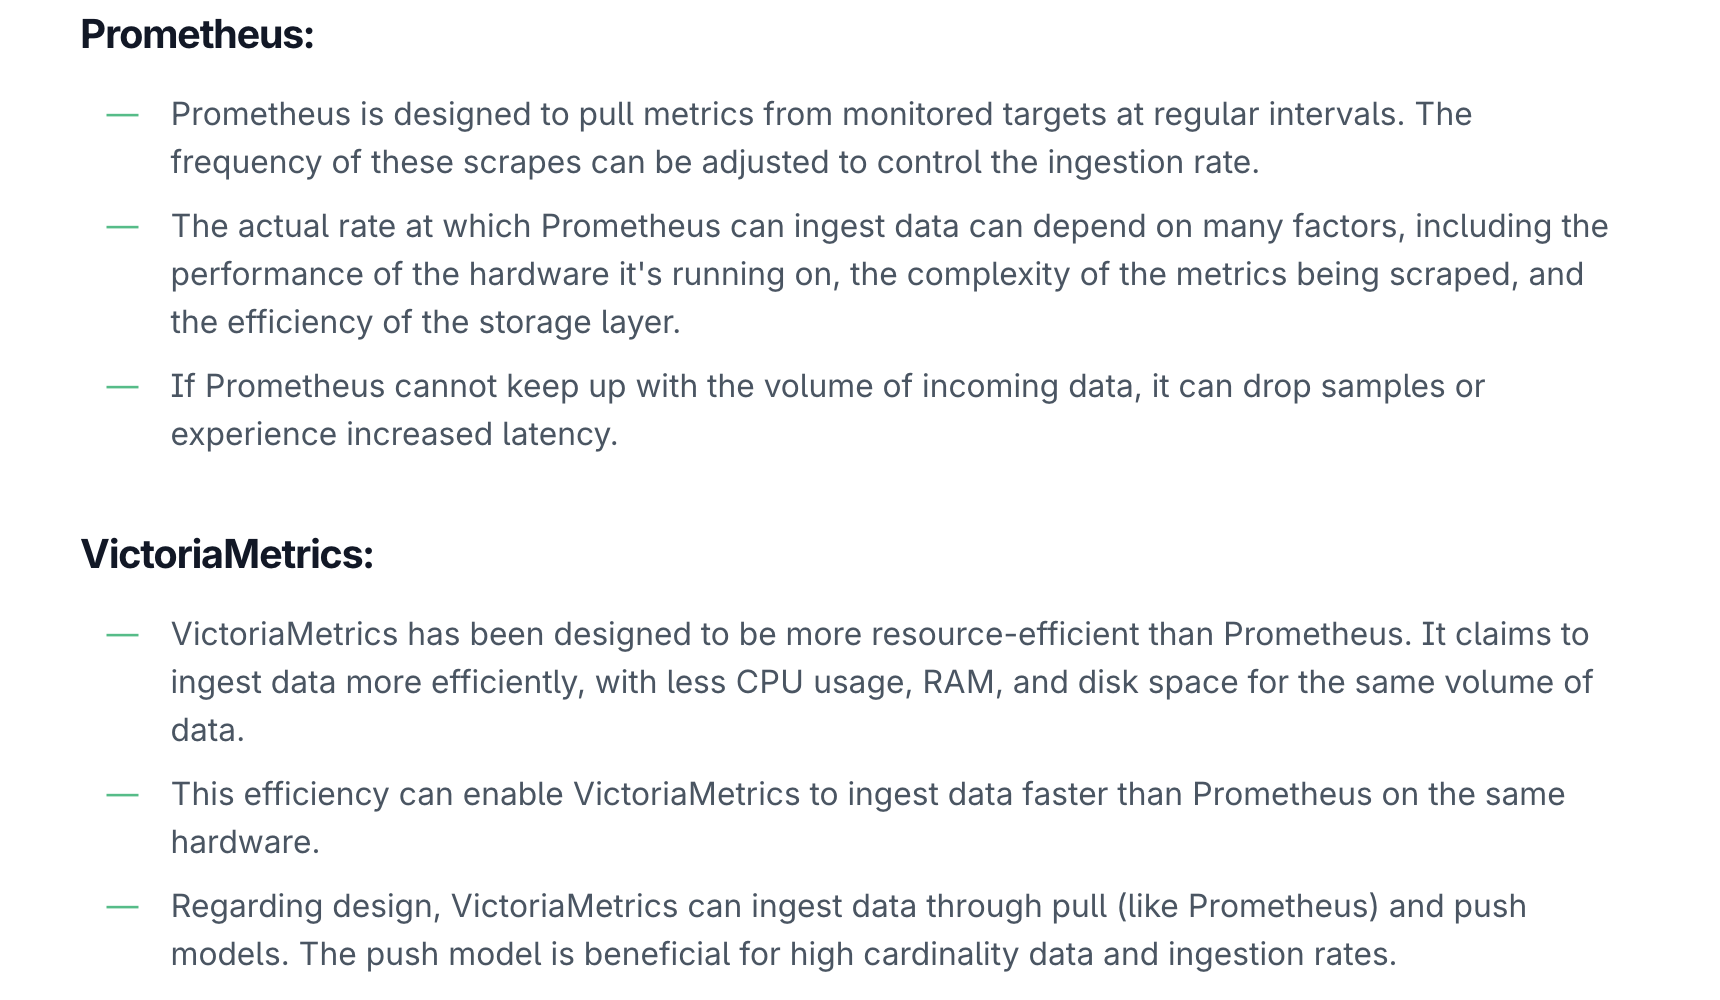
Ingestion Rate (摄取速率)
Some differences in their design can affect the ingestion rate:
High Availability and Reliability
Prometheus does not inherently support clustering, which means it does not provide native high availability. High availability can be achieved by running duplicate instances, but this process requires manual effort and coordination.
In contrast, VictoriaMetrics was designed with high availability in mind. It uses replication and clustering to ensure data is not lost in case of an instance failure, making it a more reliable option for critical applications.
Levitate commits to a 99.9% write availability and a 99.5% read availability and provides a managed offering as time series data warehouse. Get started today.
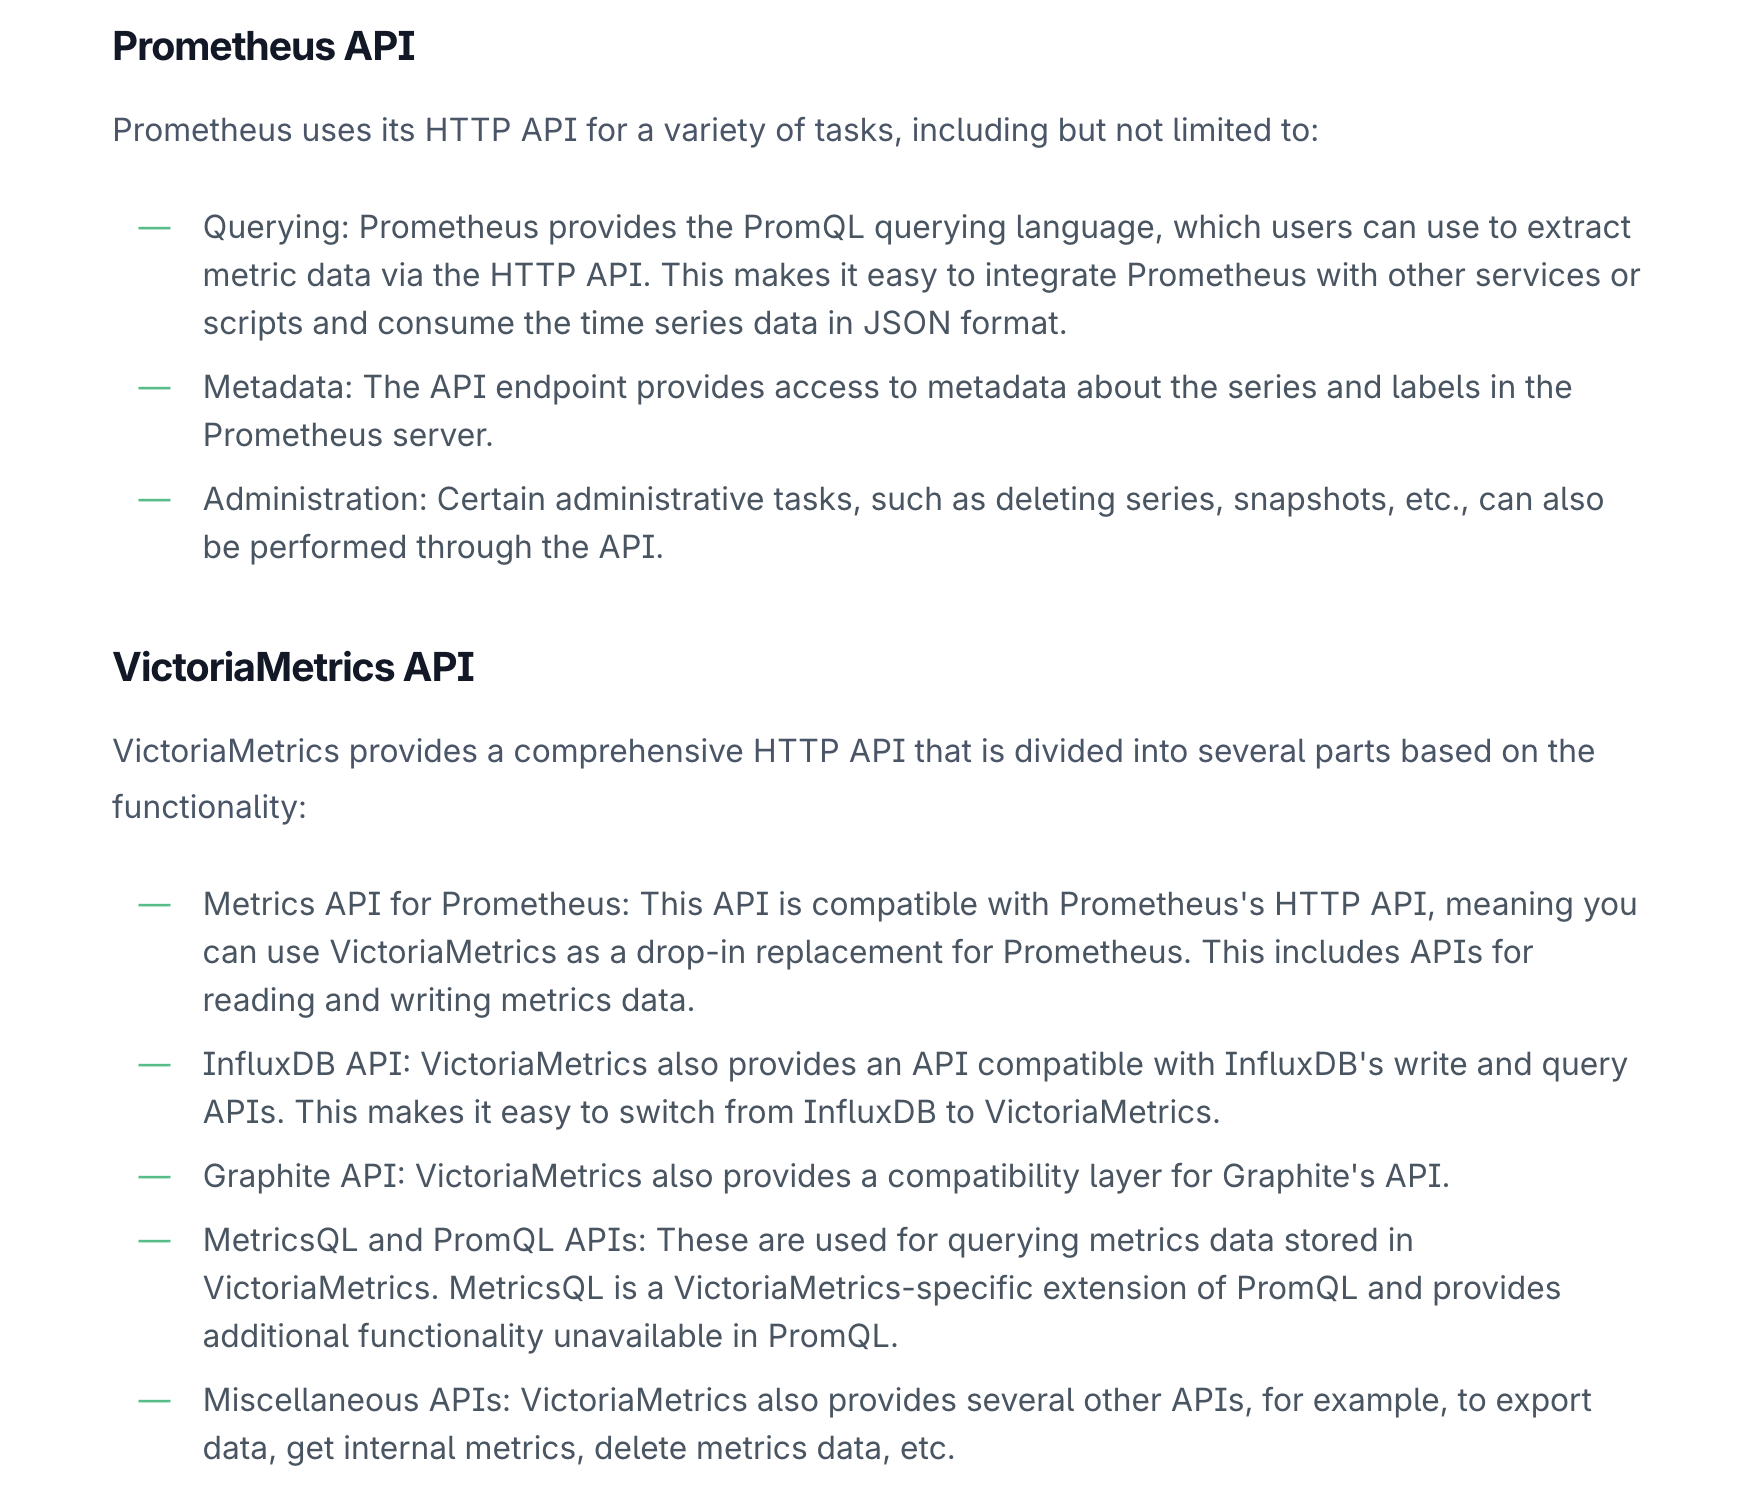
API
Prometheus and VictoriaMetrics expose their functionalities through HTTP-based APIs, allowing clients to interact with them programmatically.
Integration with Grafana
Visualizing data in Grafana for both Prometheus and VictoriaMetrics is quite similar, thanks to Grafana’s flexible data source support. Here’s an essential guide on how to visualize data from both of these systems:
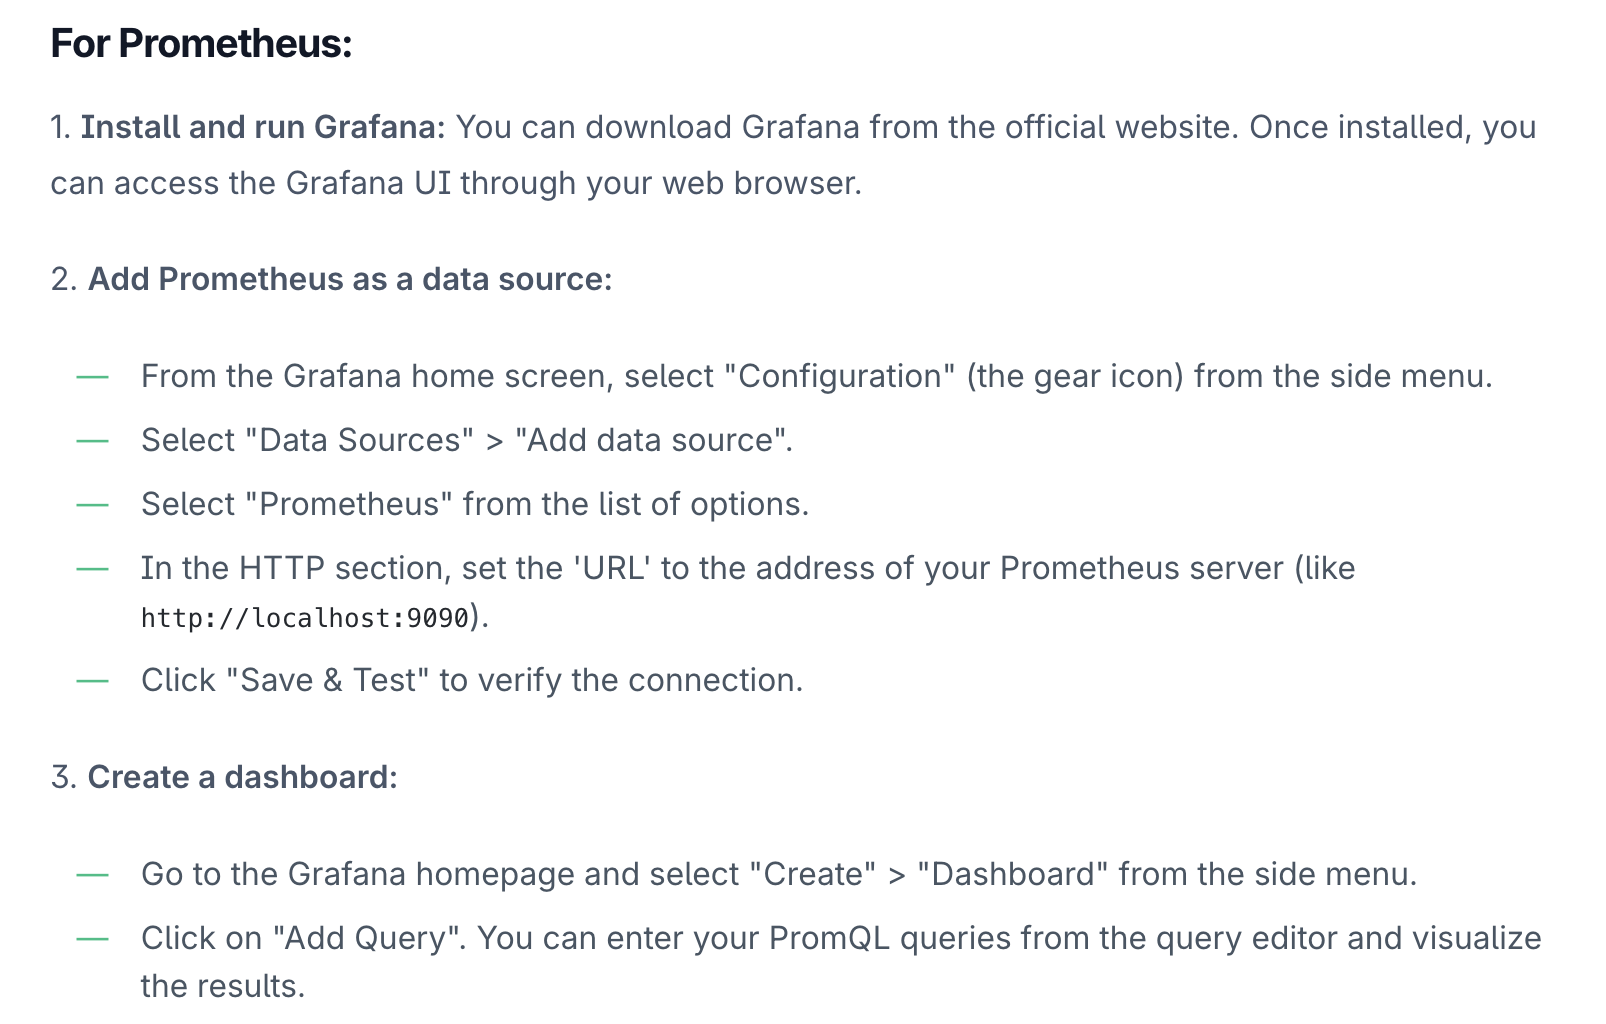
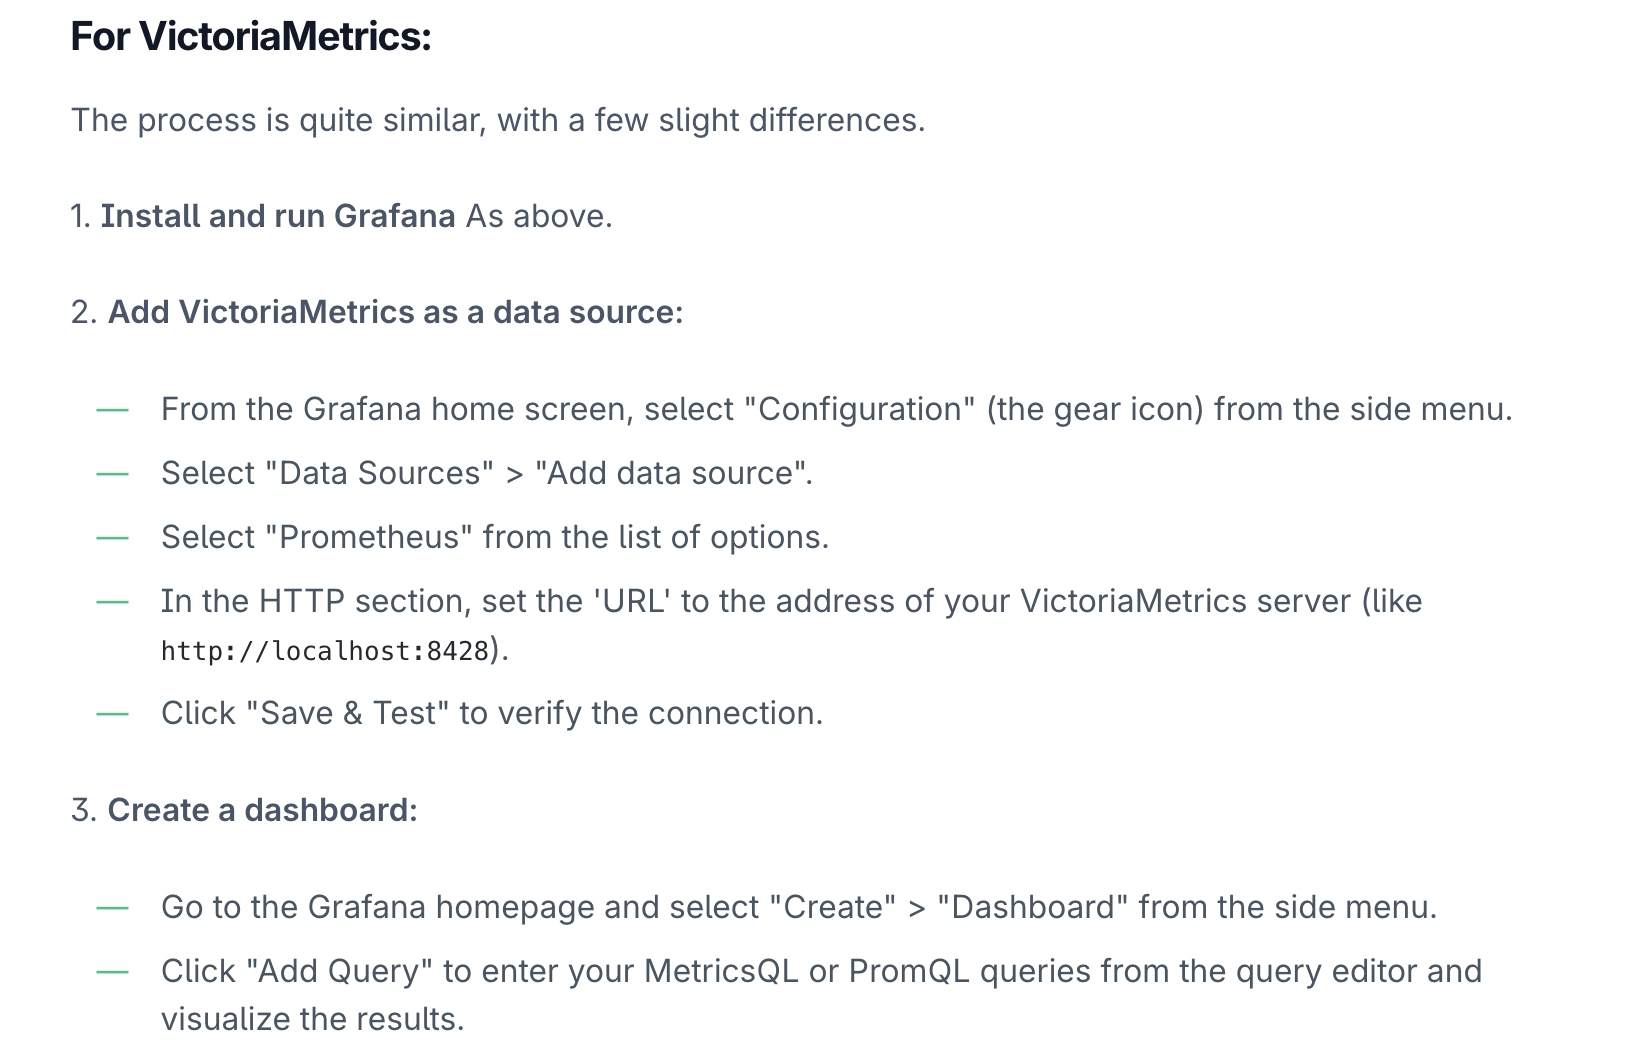
Grafana supports various visualizations like graphs, tables, heatmaps, and single stats. Once you’ve set up your data source and connected to Prometheus or VictoriaMetrics, you can create and customize these visualizations to fit your needs.
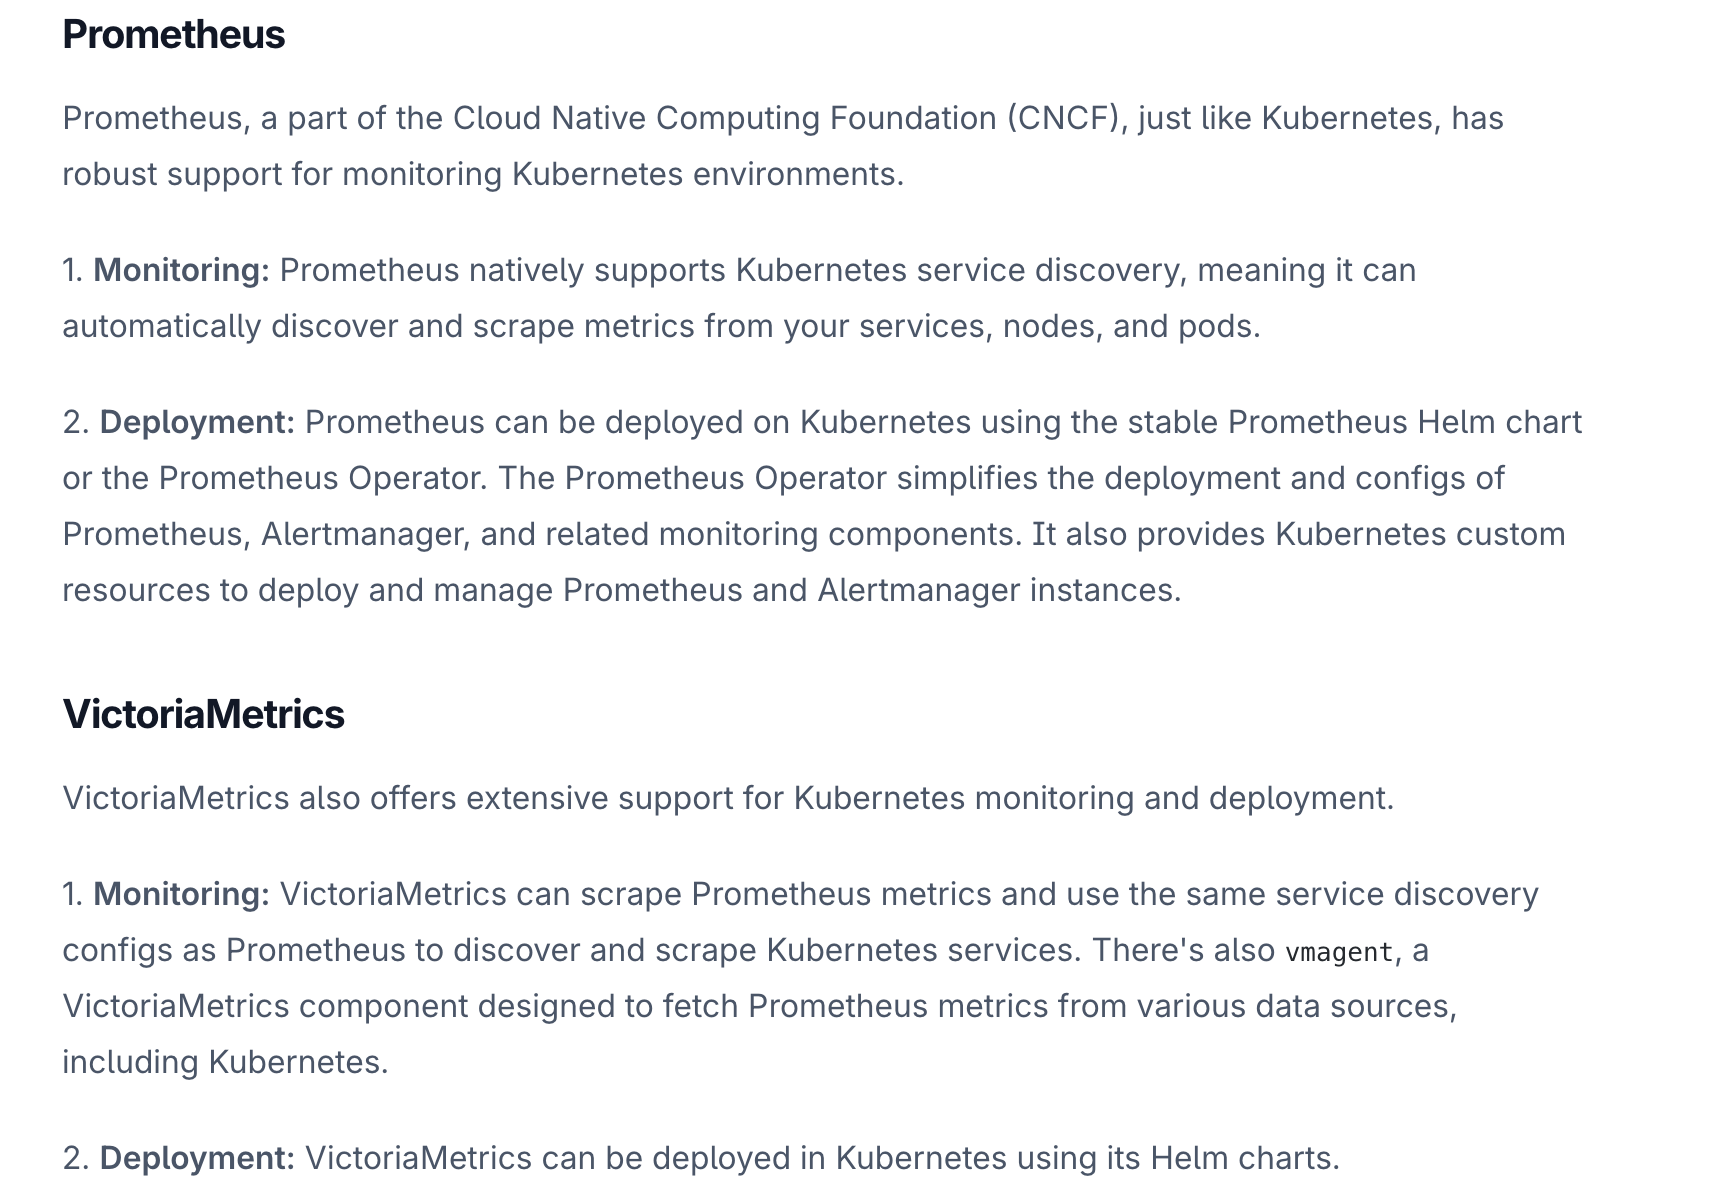
Integration with Kubernetes
Prometheus and VictoriaMetrics can monitor Kubernetes (K8s) clusters and deploy within a Kubernetes environment in cloud providers such as AWS and GCP.
Conclusion
In conclusion, using Prometheus or VictoriaMetrics will depend on your specific needs. With its powerful querying capabilities and tight integration with other CNCF projects, Prometheus might be more suitable for environments where these features are valued. On the other hand, if scalability, data compression, and high availability are your main concerns, VictoriaMetrics could be the better choice. It’s always recommended to carefully assess your monitoring needs and constraints before settling on a solution.
Compare different time series databases at one place and understand their differences.
Refer
- https://last9.io/blog/prometheus-vs-victoriametrics/
- https://last9.io/blog/prometheus-vs-influxdb
- https://last9.io/blog/what-is-prometheus
- https://prometheus.io/docs/introduction/overview/
- docs.victoriametrics.com
- Compare Time Series Databases