GCC/Clang Compilation Optimize
- GNU Binutils
- DWARF
- Precompiled Headers
- 编译加速 (统一编译)
- 编译优化级别
- Options for Debugging Your Program - GCC - 调试相关的编译选项
- Include What You Use (A tool for use with clang to analyze #includes in C and C++ source files)
- BOLT (链接后优化技术)
- 编译二进制大小优化
- 其他
- 编译优化过程调试
- Q&A
- Refer
GNU Binutils
The GNU Binary Utilities, or binutils, are a set of programming tools for creating and managing binary programs, object files, libraries, profile data, and assembly source code.
The GNU Binutils are typically used in conjunction with compilers such as the GNU Compiler Collection (gcc), build tools like make, and the GNU Debugger (gdb).
The binutils include the following commands:
| name | usage |
|---|---|
| as | assembler popularly known as GAS (GNU Assembler) |
| ld | linker |
| gprof | profiler |
| addr2line | convert address to file and line |
| ar | create, modify, and extract from archives |
| c++filt | demangling filter for C++ symbols |
| dlltool | creation of Windows dynamic-link libraries |
| gold | alternative linker for ELF files |
| nlmconv | object file conversion to a NetWare Loadable Module |
| nm | list symbols exported by object file |
| objcopy | copy object files, possibly making changes |
| objdump | dump information about object files |
| ranlib | generate indices for archives (for compatibility; same as ar -s) |
| readelf | display content of ELF files |
| size | list total and section sizes |
| strings | list printable strings |
| strip | remove symbols from an object file |
| windmc | generates Windows message resources |
| windres | compiler for Windows resource files |
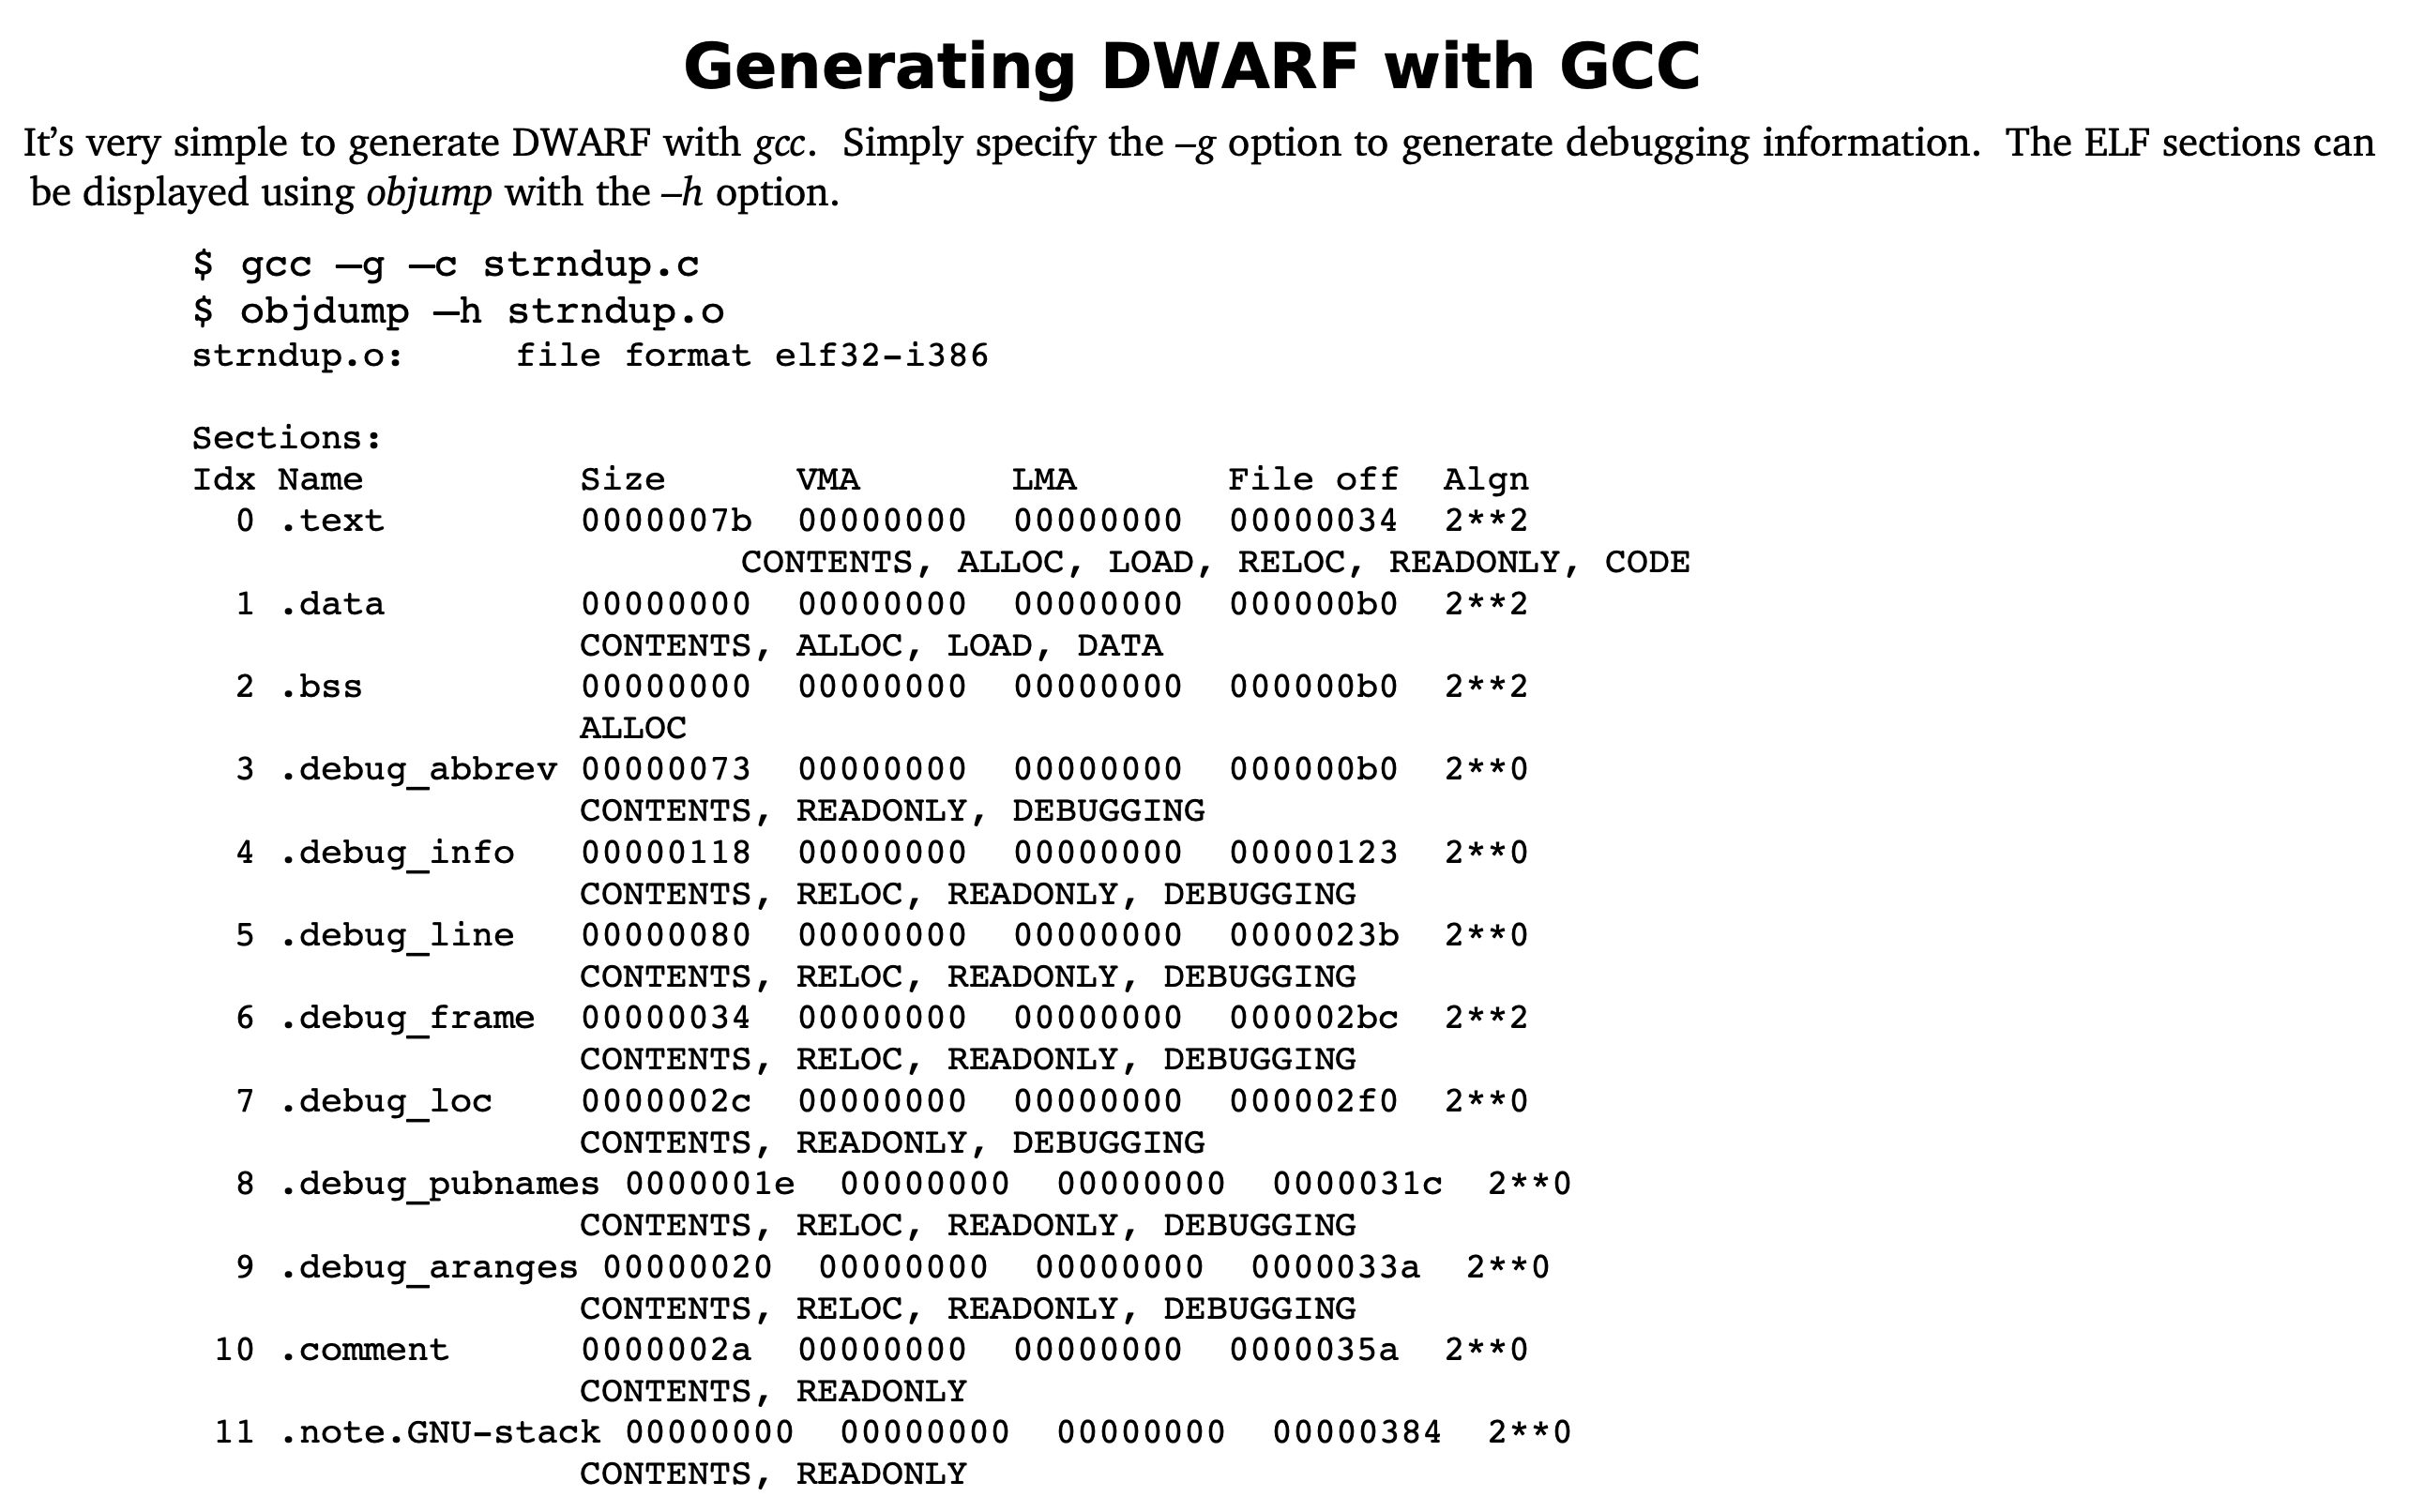
DWARF
The name DWARF is something of a pun, since it was developed along with the ELF object file format. The name is an acronym for “Debugging With Arbitrary Record Formats”.
DWARF is a widely used, standardized debugging data format. DWARF was originally designed along with Executable and Linkable Format (ELF), although it is independent of object file formats. The name is a medieval fantasy complement to “ELF” that had no official meaning, although the backronym “Debugging With Arbitrary Record Formats” has since been proposed.
DWARF 是一种用于表示源代码调试信息的标准格式。调试信息通常包括变量名、类型信息、行号等,用于在调试过程中帮助开发人员了解程序的运行状态。DWARF 的不同版本提供了不同的特性和优化,其中 DWARF version 5 是最新的版本,它引入了许多改进,包括更紧凑的表示形式和更高效的数据访问方式。
GCC 11 将 DWARF version 5 作为默认的 debug info 版本,这意味着当使用 GCC 11 编译项目时,生成的二进制文件将包含 DWARF version 5 格式的调试信息。由于 DWARF version 5 的优化,这使得生成的二进制文件尺寸显著缩小,同时仍保留了丰富的调试信息。
在实际项目中,这种尺寸缩小可以带来诸多好处,如节省磁盘空间、加快传输速度和提高加载速度等。因此,升级到 GCC 11 可以帮助开发人员更高效地处理大型项目和二进制文件。
More:
- https://en.wikipedia.org/wiki/DWARF
- DWARF, 调试信息存储格式
- Michael J. Eager (April 2012). “Introduction to the DWARF Debugging Format” (PDF). Retrieved 2015-01-08.
- https://dwarfstd.org/dwarf5-press-release.html
Debugging Formats
There are several debugging formats: stabs, COFF, PE-COFF, OMF, IEEE-695, and two variants of DWARF, to name some common ones. I’m not going to describe these in any detail. The intent here is only to mention them to place the DWARF Debugging Format in context.
The name stabs comes from symbol table strings, since the debugging data were originally saved as strings in Unix’s a.out object file’s symbol table. Stabs encodes the information about a program in text strings. Initially quite simple, stabs has evolved over time into a quite complex, occasionally cryptic and less-than-consistent debugging format. Stabs is not standardized nor well documented. Sun Microsystems has made a number of extensions to stabs. GCC has made other extensions, while attempting to reverse engineer the Sun extensions. Nonetheless, stabs is still widely used.
A Brief History of DWARF
DWARF 1 ─ Unix SVR4 sdb and PLSIG
Dwarf was developed by Brian Russell, Ph.D., at Bell Labs in 1988 for use with the C compiler and sdb debugger in Unix System V Release 4 (SVR4). The Programming Languages Special Interest Group (PLSIG), part of Unix International (UI), documented the DWARF generated by SVR4 as DWARF Version 1 in 1992. Although the original DWARF had several clear shortcomings, most notably that it was not very compact, the PLSIG decided to standardize the SVR4 format with only minimal modification. It was widely adopted within the embedded sector where it continues to be used today, especially for small processors.
DWARF 2 ─ PLSIG
The PLSIG continued to develop and document extensions to DWARF to address several issues, the most important of which was to reduce the size of debugging data that were generated. There were also additions to support new languages such as the upandcoming C++ language. DWARF Version 2 was released as a draft standard in 1993.
Since Unix International had disappeared and PLSIG disbanded, several organizations independently decided to extend DWARF 1 and 2. Some of these extensions were specific to a single architecture, but others might be applicable to any architecture. Unfortunately, the different organizations didn’t work together on these extensions. Documentation on the extensions is generally spotty or difficult to obtain. Or as a GCC developer might suggest, tongue firmly in cheek, the extensions were well documented: all you have to do is read the compiler source code. DWARF was well on its way to following COFF and becoming a collection of divergent implementations rather than being an industry standard.
DWARF 3 ─ Free Standards Group
Despite several online discussions about DWARF on the PLSIG email list (which survived under X/Open [later Open Group] sponsorship after UI’s demise), there was little impetus to revise (or even finalize) the document until the end of 1999. At that time, there was interest in extending DWARF to have better support for the HP/Intel IA64 architecture as well as better documentation of the ABI used by C++ programs. These two efforts separated, and the author took over as Chair for the revived DWARF Committee.
DWARF 4 ─ DWARF Debugging Format Committee
After the Free Standards Group merged with Open Source Development Labs (OSDL) in 2007 to form the Linux Foundation, the DWARF Committee returned to independent status and created its own web site at dwarfstd.org. Work began on Version 4 of the DWARF in 2007.
The DWARF Version 4 Standard was released in June, 2010, following a public review.
Work on DWARF Version 5 started in February, 2012. This version is expected to be completed in 2014.
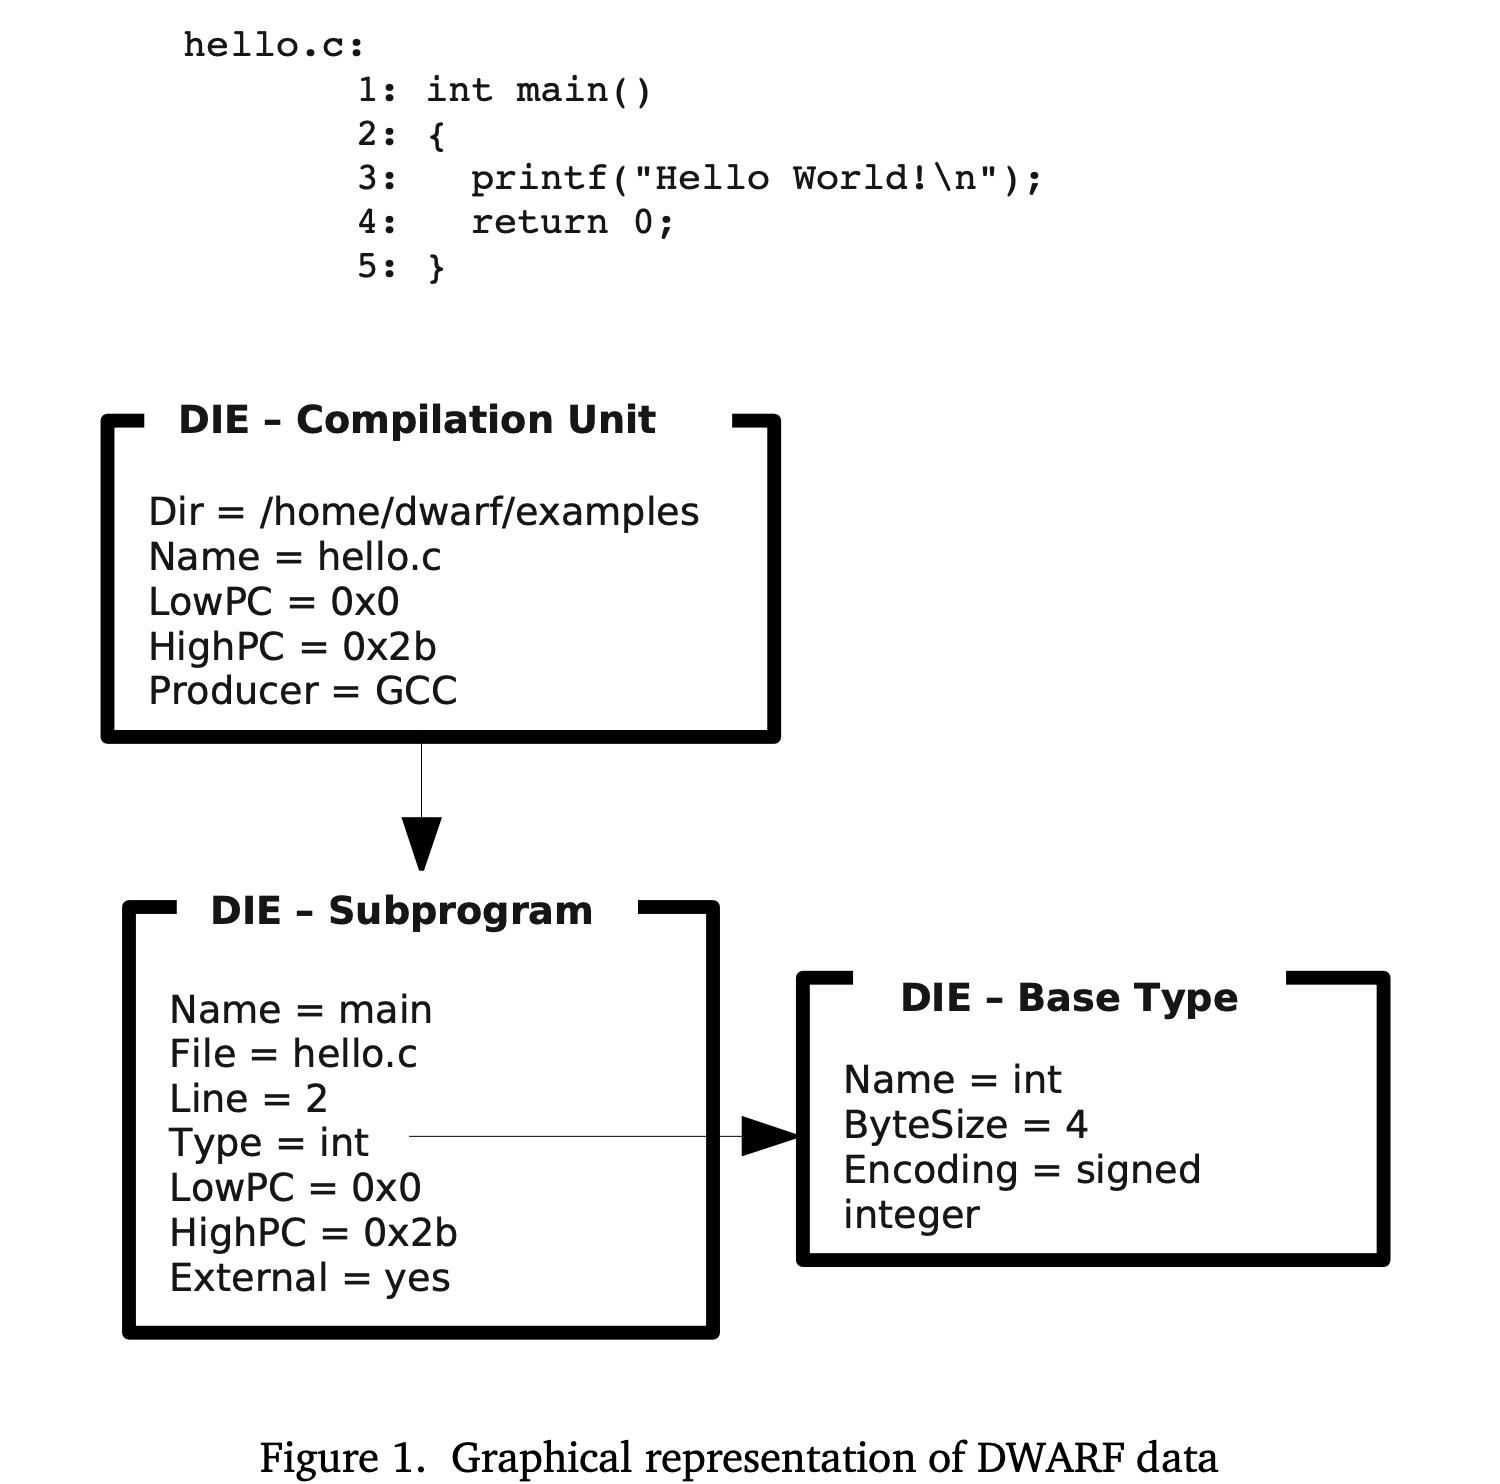
Debugging Information Entry (DIE)
- Tags and Attributes
The basic descriptive entity in DWARF is the Debugging Information Entry (DIE). A DIE has a tag, which specifies what the DIE describes and a list of attributes which fill in details and further describes the entity.
A DIE (except for the topmost) is contained in or owned by a parent DIE and may have sibling DIEs or children DIEs. Attributes may contain a variety of values: constants (such as a function name), variables (such as the start address for a function), or references to another DIE (such as for the type of a function’s return value).
The following figure shows C’s classic hello.c program with a simplified graphical representation of its DWARF description. The topmost DIE represents the compilation unit. It has two “children”, the first is the DIE describing main and the second describing the base type int which is the type of the value returned by main. The subprogram DIE is a child of the compilation unit DIE, while the base type DIE is referenced by the Type attribute in the subprogram DIE. We also talk about a DIE “owning” or “containing” the children DIEs.
- Types of DIEs
DIEs can be split into two general types. Those that describe data including data types and those that describe functions and other executable code.
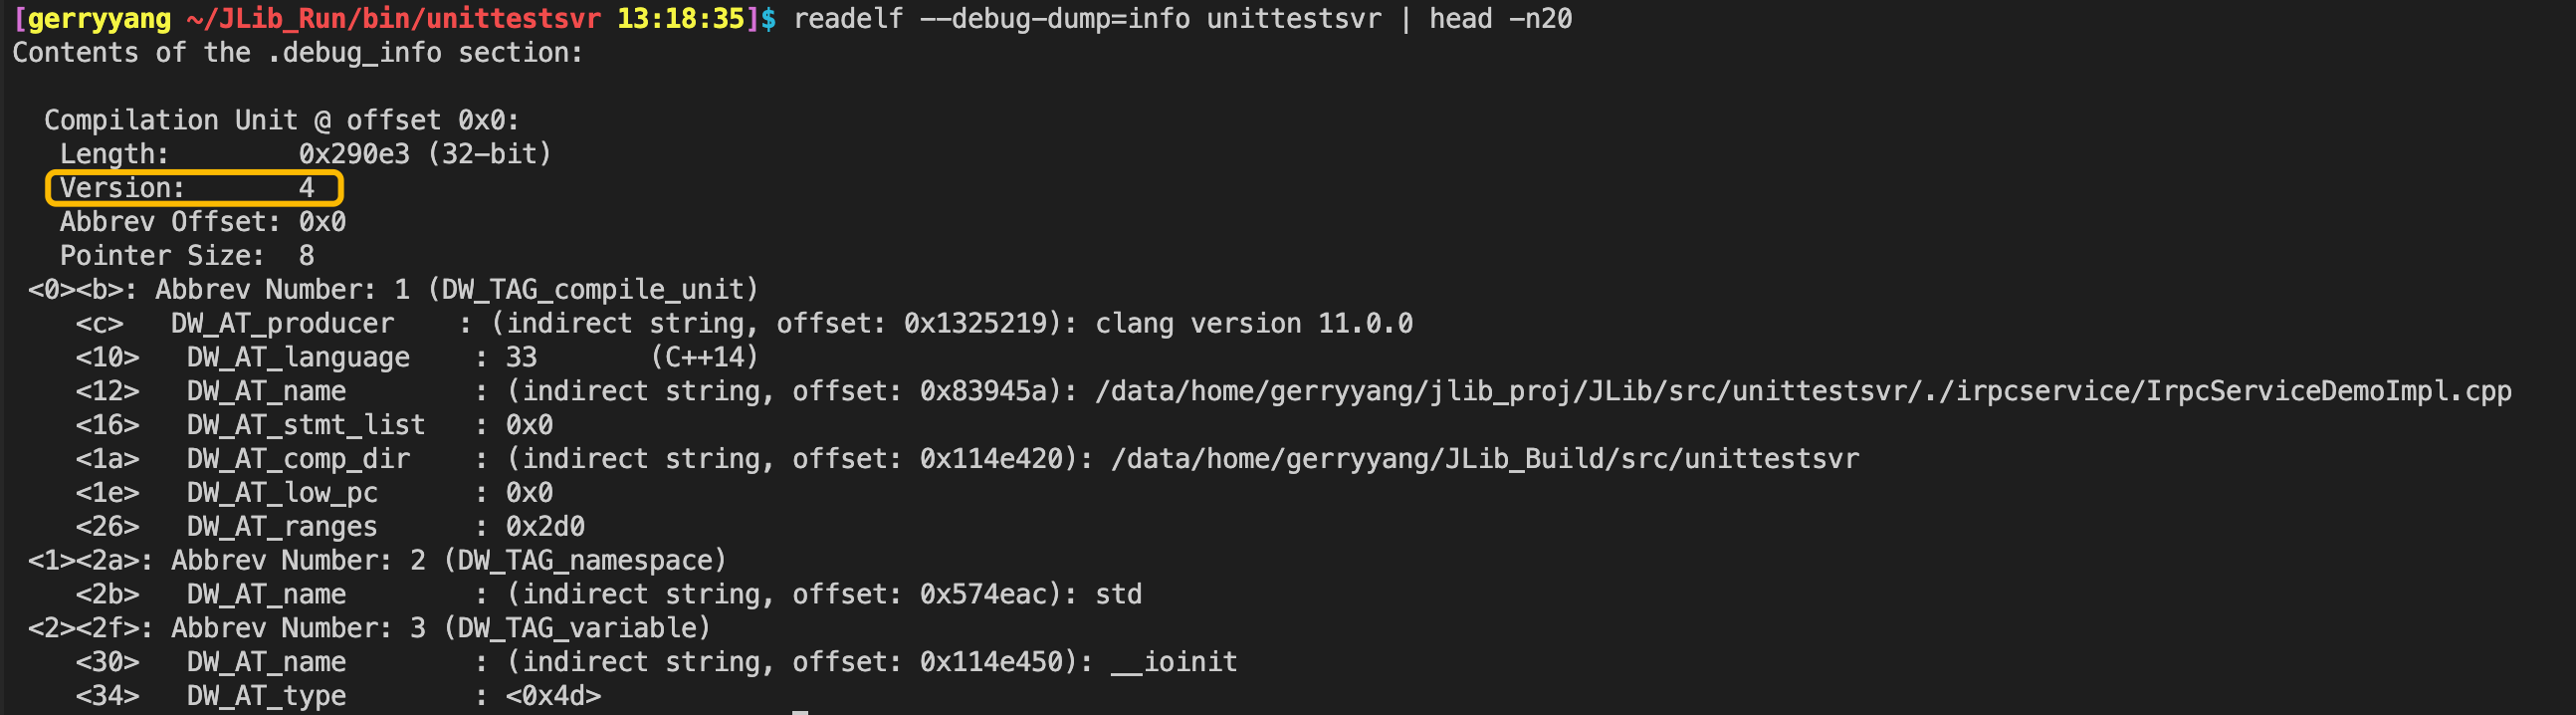
查看当前二进制文件使用的 DWARF 调试信息版本
readelf --debug-dump=info <your_binary> | head -20
如果遇到 addr2line 的 DWARF 错误,尝试使用 DWARF 4 版本重新编译:
gcc -gdwarf-4 -g3 -o myapp source.c
GDB 兼容性:
- GDB < 8.0:仅支持到 DWARF 4
- GDB >= 8.1:完整支持 DWARF 5
Precompiled Headers
This document describes the design and implementation of Clang’s precompiled headers (PCH). If you are interested in the end-user view, please see the User’s Manual.
更多参考:
- Clang precompiled headers and improving C++ compile times, conclusion
- Why precompiled headers do (not) improve C++ compile times
- How do I generate and use precompiled headers with Clang++?
Using Precompiled Headers with clang
The Clang compiler frontend, clang -cc1, supports two command line options for generating and using PCH files.
To generate PCH files using clang -cc1, use the option -emit-pch:
$ clang -cc1 test.h -emit-pch -o test.h.pch
This option is transparently used by clang when generating PCH files. The resulting PCH file contains the serialized form of the compiler’s internal representation after it has completed parsing and semantic analysis. The PCH file can then be used as a prefix header with the -include-pch option:
$ clang -cc1 -include-pch test.h.pch test.c -o test.s
说明:上面的
clang -cc1在实际使用中应替换为clang++。例如,要生成预编译头文件my_header.pch,可以使用命令clang++ -x c++-header -std=c++11 -o my_header.pch my_header.hpp
Design Philosophy
Precompiled headers are meant to improve overall compile times for projects, so the design of precompiled headers is entirely driven by performance concerns. The use case for precompiled headers is relatively simple: when there is a common set of headers that is included in nearly every source file in the project, we precompile that bundle of headers into a single precompiled header (PCH file). Then, when compiling the source files in the project, we load the PCH file first (as a prefix header), which acts as a stand-in for that bundle of headers.
A precompiled header implementation improves performance when:
-
Loading the PCH file is significantly faster than re-parsing the bundle of headers stored within the PCH file. Thus, a precompiled header design attempts to minimize the cost of reading the PCH file. Ideally, this cost should not vary with the size of the precompiled header file.
-
The cost of generating the PCH file initially is not so large that it counters the per-source-file performance improvement due to eliminating the need to parse the bundled headers in the first place. This is particularly important on multi-core systems, because PCH file generation serializes the build when all compilations require the PCH file to be up-to-date.
预编译头文件的实现主要在以下两个方面改善性能:
加载 PCH 文件的速度明显快于重新解析 PCH 文件中存储的头文件集合。因此,预编译头文件设计试图最小化读取 PCH 文件的成本。理想情况下,这个成本不应随预编译头文件的大小而变化。 这意味着,通过使用预编译头文件,编译器可以快速地加载已经解析过的头文件内容,而不需要重新解析这些头文件。这将减少每个源文件的编译时间,从而提高整个项目的编译速度。
生成 PCH 文件的初始成本不应过大,以免抵消由于消除解析捆绑头文件的需要而带来的每个源文件的性能改进。这在多核系统上尤为重要,因为 PCH 文件生成会在所有编译都需要最新的 PCH 文件时序列化构建。 这意味着,尽管生成预编译头文件会带来一定的开销,但这个开销不应过大,以免影响预编译头文件带来的性能提升。在多核系统上,这一点尤为重要,因为生成预编译头文件可能会导致编译过程中的其他任务等待,从而降低并行编译的效果。
总之,预编译头文件实现通过加快加载 PCH 文件的速度和控制生成 PCH 文件的成本来提高编译性能。这使得编译器能够更快地处理头文件,从而提高整个项目的编译速度。
Clang’s precompiled headers are designed with a compact on-disk representation, which minimizes both PCH creation time and the time required to initially load the PCH file. The PCH file itself contains a serialized representation of Clang’s abstract syntax trees and supporting data structures, stored using the same compressed bitstream as LLVM’s bitcode file format.
Clang’s precompiled headers are loaded “lazily” from disk. When a PCH file is initially loaded, Clang reads only a small amount of data from the PCH file to establish where certain important data structures are stored. The amount of data read in this initial load is independent of the size of the PCH file, such that a larger PCH file does not lead to longer PCH load times. The actual header data in the PCH file–macros, functions, variables, types, etc.–is loaded only when it is referenced from the user’s code, at which point only that entity (and those entities it depends on) are deserialized from the PCH file. With this approach, the cost of using a precompiled header for a translation unit is proportional to the amount of code actually used from the header, rather than being proportional to the size of the header itself.
Clang 编译器如何以“懒加载”(lazy loading)的方式从磁盘加载预编译头文件(PCH)。懒加载意味着只有在实际需要时才加载数据,这有助于提高性能和降低内存使用。
当 PCH 文件最初被加载时,Clang 只从 PCH 文件中读取少量数据以确定某些重要数据结构的存储位置。这个初始加载阶段读取的数据量与 PCH 文件的大小无关,因此较大的 PCH 文件不会导致更长的加载时间。
PCH 文件中的实际头文件数据(如宏、函数、变量、类型等)只有在用户代码中引用时才会被加载。此时,只有该实体(以及它所依赖的实体)会从 PCH 文件中被反序列化。通过这种方法,使用预编译头文件的成本与实际从头文件中使用的代码量成正比,而不是与头文件的大小成正比。
总之,Clang 编译器通过懒加载的方式从磁盘加载预编译头文件,从而提高了性能。这种方法使得使用预编译头文件的成本与实际使用的代码量成正比,而不是与头文件的大小成正比。这有助于在保持编译速度的同时,降低内存使用。
When given the -print-stats option, Clang produces statistics describing how much of the precompiled header was actually loaded from disk. For a simple “Hello, World!” program that includes the Apple Cocoa.h header (which is built as a precompiled header), this option illustrates how little of the actual precompiled header is required:
*** PCH Statistics:
  933 stat cache hits
  4 stat cache misses
  895/39981 source location entries read (2.238563%)
  19/15315 types read (0.124061%)
  20/82685 declarations read (0.024188%)
  154/58070 identifiers read (0.265197%)
  0/7260 selectors read (0.000000%)
  0/30842 statements read (0.000000%)
  4/8400 macros read (0.047619%)
  1/4995 lexical declcontexts read (0.020020%)
  0/4413 visible declcontexts read (0.000000%)
  0/7230 method pool entries read (0.000000%)
  0 method pool misses
For this small program, only a tiny fraction of the source locations, types, declarations, identifiers, and macros were actually deserialized from the precompiled header. These statistics can be useful to determine whether the precompiled header implementation can be improved by making more of the implementation lazy.
Precompiled headers can be chained. When you create a PCH while including an existing PCH, Clang can create the new PCH by referencing the original file and only writing the new data to the new file. For example, you could create a PCH out of all the headers that are very commonly used throughout your project, and then create a PCH for every single source file in the project that includes the code that is specific to that file, so that recompiling the file itself is very fast, without duplicating the data from the common headers for every file.
预编译头文件(PCH)可以被链接在一起。当你在创建一个新的 PCH 时包含了一个已有的 PCH,Clang 可以通过引用原始文件并只将新数据写入新文件来创建新的 PCH。这种方法允许在不重复公共头文件数据的情况下,更高效地为每个源文件创建 PCH。
举个例子,你可以为项目中经常使用的所有头文件创建一个 PCH,然后为项目中的每个源文件创建一个 PCH,该 PCH 包含特定于该文件的代码。这样,在重新编译文件本身时,速度会非常快,同时避免了为每个文件重复公共头文件的数据。
通过链接预编译头文件,可以在保持编译速度的同时,减少生成的 PCH 文件的大小。这种方法在处理大型项目时尤为有用,因为它可以有效地减少编译时间和磁盘空间占用。
Precompiled Header Contents
Clang’s precompiled headers are organized into several different blocks, each of which contains the serialized representation of a part of Clang’s internal representation. Each of the blocks corresponds to either a block or a record within LLVM’s bitstream format. The contents of each of these logical blocks are described below.
For a given precompiled header, the llvm-bcanalyzer utility can be used to examine the actual structure of the bitstream for the precompiled header. This information can be used both to help understand the structure of the precompiled header and to isolate areas where precompiled headers can still be optimized, e.g., through the introduction of abbreviations.
- Metadata Block
- Source Manager Block
- Preprocessor Block
- Types Block
- Declarations Block
- Statements and Expressions
- Identifier Table Block
- Method Pool Block
Precompiled Header Integration Points
The “lazy” deserialization behavior of precompiled headers requires their integration into several completely different submodules of Clang. For example, lazily deserializing the declarations during name lookup requires that the name-lookup routines be able to query the precompiled header to find entities within the PCH file.
编译加速 (统一编译)
bUseUnityBuild
Whether to unify C++ code into larger files for faster compilation.

bForceUnityBuild
Whether to force C++ source files to be combined into larger files for faster compilation.
- https://stackoverflow.com/questions/45110783/when-do-i-need-to-include-cpp-files
- https://accu.org/journals/overload/25/138/thomason_2360/
- https://leegoonz.blog/2020/04/26/disable-to-buseunitybuild-even-building-to-ue4-source-code/
- https://docs.unrealengine.com/5.1/en-US/build-configuration-for-unreal-engine/
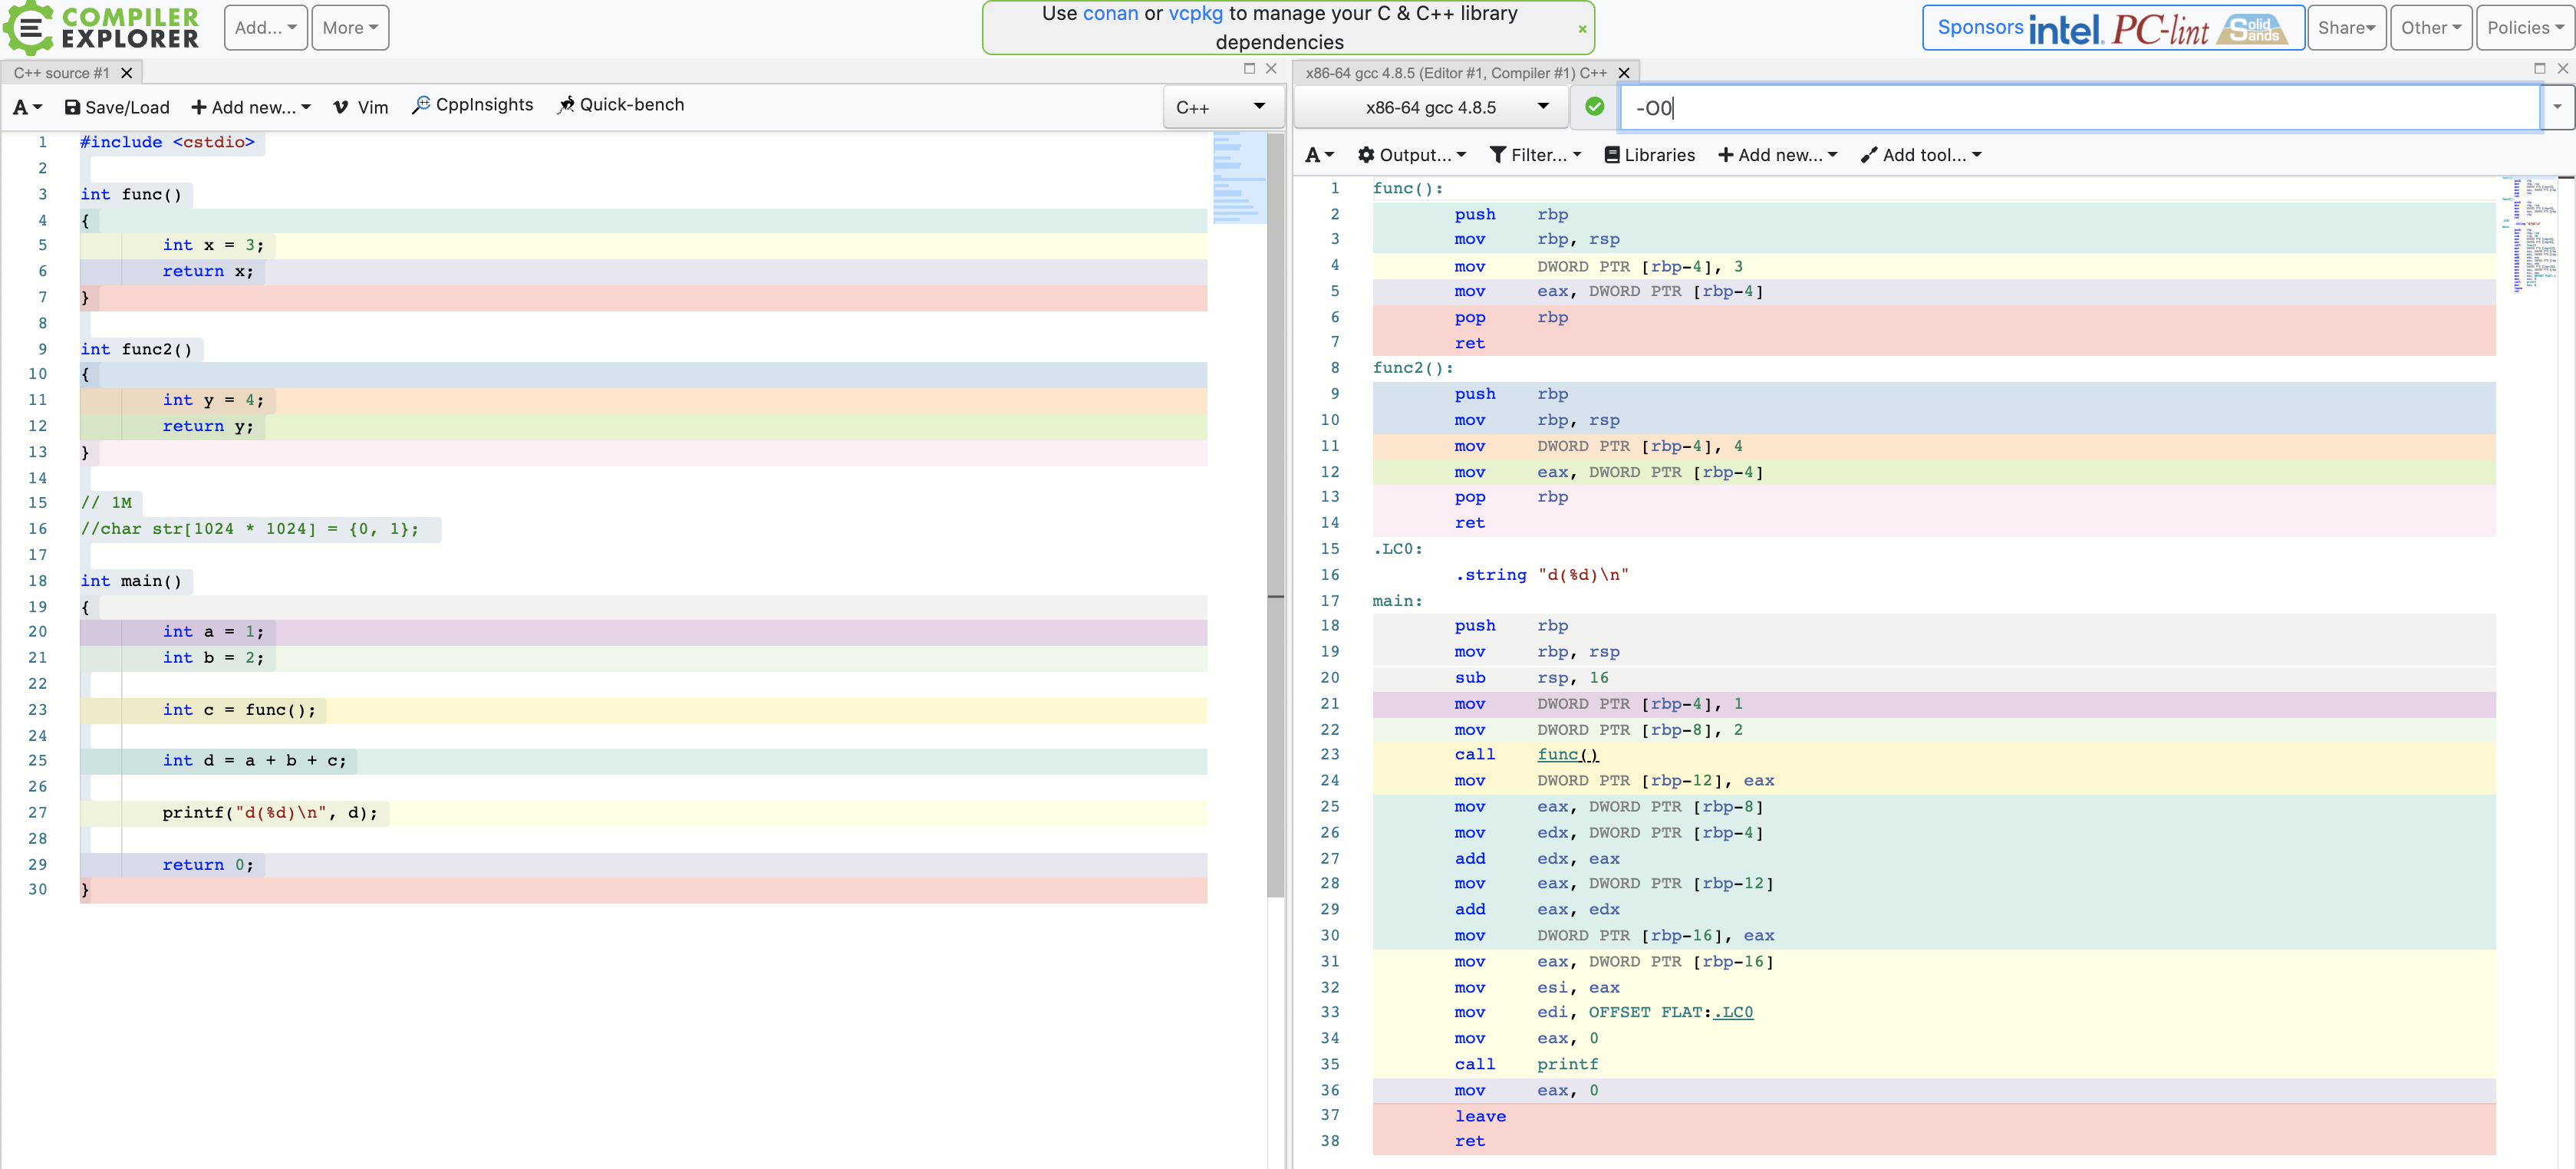
编译优化级别
gcc
- 编译环境:x86-64 gcc 4.8.5
- 在线编译工具:https://gcc.godbolt.org/
- GCC优化选项说明:Options That Control Optimization
gcc默认使用-O0优化级别,可以通过gcc -Q --help=optimizers -O<number>查看每个优化级别的差异。
$gcc -Q --help=optimizers -O0 | head -n20
The following options control optimizations:
  -O<number>
  -Ofast
  -Og
  -Os
  -faggressive-loop-optimizations       [enabled]
  -falign-functions                     [disabled]
  -falign-jumps                         [disabled]
  -falign-labels                        [disabled]
  -falign-loops                         [disabled]
  -fasynchronous-unwind-tables          [enabled]
  -fbranch-count-reg                    [enabled]
  -fbranch-probabilities                [disabled]
  -fbranch-target-load-optimize         [disabled]
  -fbranch-target-load-optimize2        [disabled]
  -fbtr-bb-exclusive                    [disabled]
  -fcaller-saves                        [disabled]
  -fcombine-stack-adjustments           [disabled]
  -fcommon                              [enabled]
  -fcompare-elim                        [disabled]
测试代码:
#include <cstdio>

int func()
{
        int x = 3;
        return x;
}

int func2()
{
        int y = 4;
        return y;
}

// 1M
//char str[1024 * 1024] = {0, 1};

int main()
{
        int a = 1;
        int b = 2;

        int c = func();

        int d = a + b + c;

        printf("d(%d)\n", d);

        return 0;
}
Makefile:
# Compare gcc and clang, default is gcc

#CC = /root/compile/llvm_install/bin/clang
#CXX = /root/compile/llvm_install/bin/clang++

CFLAGS = -Werror -Wall -g -pipe

CFLAGS += -O0
#CFLAGS += -O1
#CFLAGS += -O2
#CFLAGS += -O3

# https://gcc.gnu.org/onlinedocs/gcc-4.8.5/gcc/Optimize-Options.html#Optimize-Options
# https://gcc.gnu.org/onlinedocs/gcc-4.8.5/gcc/Link-Options.html#Link-Options
CFLAGS += -fdata-sections -ffunction-sections

INCLUDE = -I./
LIBPATH = -L./
LIBS =

BIN = demo

OBJS = demo.o

MAP_FILE = mapfile

.PHONY: clean

all: $(BIN)

$(BIN): $(OBJS)
        #$(CXX) -o $@ $^ $(LIBPATH) $(LIBS) -Wl,-Map=$(MAP_FILE)
        $(CXX) -o $@ $^ $(LIBPATH) $(LIBS) -Wl,-Map=$(MAP_FILE) -Wl,--gc-sections
        @echo "build $(BIN) ok"

install:
        @echo "nothing to install"

clean:
        rm -f $(OBJS) $(BIN) $(MAP_FILE)


%.o: %.cpp
        $(CXX) $(CFLAGS) $(INCLUDE) -c $<
%.o: %.c
        $(CC) $(CFLAGS) $(INCLUDE) -c $<
使用gcc编译,优化选项(默认级别,不做优化):-O0
(gdb) b main
Breakpoint 1 at 0x400605: file demo.cpp, line 20.
(gdb) r
Starting program: /root/test/cpp/cpp_strip/demo

Breakpoint 1, main () at demo.cpp:20
20              int a = 1;
Missing separate debuginfos, use: debuginfo-install glibc-2.17-196.tl2.3.x86_64 libgcc-4.8.5-4.el7.x86_64 libstdc++-4.8.5-4.el7.x86_64
(gdb) disassemble /m main
Dump of assembler code for function main():
19      {
   0x00000000004005fd <+0>:     push   %rbp
   0x00000000004005fe <+1>:     mov    %rsp,%rbp
   0x0000000000400601 <+4>:     sub    $0x10,%rsp

20              int a = 1;
=> 0x0000000000400605 <+8>:     movl   $0x1,-0x4(%rbp)

21              int b = 2;
   0x000000000040060c <+15>:    movl   $0x2,-0x8(%rbp)

22
23              int c = func();
   0x0000000000400613 <+22>:    callq  0x4005ed <func()>
   0x0000000000400618 <+27>:    mov    %eax,-0xc(%rbp)

24
25              int d = a + b + c;
   0x000000000040061b <+30>:    mov    -0x8(%rbp),%eax
   0x000000000040061e <+33>:    mov    -0x4(%rbp),%edx
   0x0000000000400621 <+36>:    add    %eax,%edx
   0x0000000000400623 <+38>:    mov    -0xc(%rbp),%eax
   0x0000000000400626 <+41>:    add    %edx,%eax
   0x0000000000400628 <+43>:    mov    %eax,-0x10(%rbp)

26
27              printf("d(%d)\n", d);
   0x000000000040062b <+46>:    mov    -0x10(%rbp),%eax
   0x000000000040062e <+49>:    mov    %eax,%esi
   0x0000000000400630 <+51>:    mov    $0x4006cd,%edi
   0x0000000000400635 <+56>:    mov    $0x0,%eax
   0x000000000040063a <+61>:    callq  0x4004d0 <printf@plt>

28
29              return 0;
   0x000000000040063f <+66>:    mov    $0x0,%eax

30      }
   0x0000000000400644 <+71>:    leaveq
   0x0000000000400645 <+72>:    retq

End of assembler dump.
使用clang编译,优化选项(默认级别,不做优化):-O0
(gdb) b main
Breakpoint 1 at 0x40115f: file demo.cpp, line 20.
(gdb) r
Starting program: /root/test/cpp/cpp_strip/demo

Breakpoint 1, main () at demo.cpp:20
20              int a = 1;
Missing separate debuginfos, use: debuginfo-install glibc-2.17-196.tl2.3.x86_64 libgcc-4.8.5-4.el7.x86_64 libstdc++-4.8.5-4.el7.x86_64
(gdb) disas /m main
Dump of assembler code for function main:
19      {
   0x0000000000401150 <+0>:     push   %rbp
   0x0000000000401151 <+1>:     mov    %rsp,%rbp
   0x0000000000401154 <+4>:     sub    $0x20,%rsp
   0x0000000000401158 <+8>:     movl   $0x0,-0x4(%rbp)

20              int a = 1;
=> 0x000000000040115f <+15>:    movl   $0x1,-0x8(%rbp)

21              int b = 2;
   0x0000000000401166 <+22>:    movl   $0x2,-0xc(%rbp)

22
23              int c = func();
   0x000000000040116d <+29>:    callq  0x401140 <func()>
   0x0000000000401172 <+34>:    mov    %eax,-0x10(%rbp)

24
25              int d = a + b + c;
   0x0000000000401175 <+37>:    mov    -0x8(%rbp),%eax
   0x0000000000401178 <+40>:    add    -0xc(%rbp),%eax
   0x000000000040117b <+43>:    add    -0x10(%rbp),%eax
   0x000000000040117e <+46>:    mov    %eax,-0x14(%rbp)

26
27              printf("d(%d)\n", d);
   0x0000000000401181 <+49>:    mov    -0x14(%rbp),%esi
   0x0000000000401184 <+52>:    movabs $0x402000,%rdi
   0x000000000040118e <+62>:    mov    $0x0,%al
   0x0000000000401190 <+64>:    callq  0x401030 <printf@plt>
   0x0000000000401195 <+69>:    xor    %eax,%eax

28
29              return 0;
   0x0000000000401197 <+71>:    add    $0x20,%rsp
   0x000000000040119b <+75>:    pop    %rbp
   0x000000000040119c <+76>:    retq

End of assembler dump.
也可通过在线编译工具反汇编。
clang
- Clang optimization levels
- CLang optimizations on Mac OSX
- Compiling With Clang Optimization Flags
- In clang, how do you use per-function optimization attributes?
- How to change optimization level of one function?
- https://clang.llvm.org/docs/LanguageExtensions.html#extensions-for-selectively-disabling-optimization
- clang ignoring attribute noinline
- https://clang.llvm.org/docs/AttributeReference.html
- Does LLVM/clang have flags to control code padding?
To sum it up, to find out about compiler optimization passes:
llvm-as < /dev/null | opt -O3 -disable-output -debug-pass=Arguments
clang additionally runs some higher level optimizations, which we can retrieve with:
echo 'int;' | clang -xc -O3 - -o /dev/null -\#\#\#
Documentation of individual passes is available here.
You can compare the effect of changing high-level flags such as -O like this:
diff -wy --suppress-common-lines  \
  <(echo 'int;' | clang -xc -Os   - -o /dev/null -\#\#\# 2>&1 | tr " " "\n" | grep -v /tmp) \
  <(echo 'int;' | clang -xc -O2 - -o /dev/null -\#\#\# 2>&1 | tr " " "\n" | grep -v /tmp)
# will tell you that -O0 is indeed the default.
-O0 优化选项:
$echo 'int;' | clang -xc -O0 - -o /dev/null -\#\#\#
clang version 3.5.2 (tags/RELEASE_352/final)
Target: x86_64-unknown-linux-gnu
Thread model: posix
 "/usr/local/bin/clang-3.5" "-cc1" "-triple" "x86_64-unknown-linux-gnu" "-emit-obj" "-mrelax-all" "-disable-free" "-disable-llvm-verifier" "-main-file-name" "-" "-mrelocation-model" "static" "-mdisable-fp-elim" "-fmath-errno" "-masm-verbose" "-mconstructor-aliases" "-munwind-tables" "-fuse-init-array" "-target-cpu" "x86-64" "-dwarf-column-info" "-resource-dir" "/usr/local/bin/../lib/clang/3.5.2" "-internal-isystem" "/usr/local/include" "-internal-isystem" "/usr/local/bin/../lib/clang/3.5.2/include" "-internal-externc-isystem" "/include" "-internal-externc-isystem" "/usr/include" "-O0" "-fdebug-compilation-dir" "/data/home/gerryyang/pracing/build/release/src/gamesvr/CMakeFiles/gamesvr.dir" "-ferror-limit" "19" "-fmessage-length" "198" "-mstackrealign" "-fobjc-runtime=gcc" "-fdiagnostics-show-option" "-fcolor-diagnostics" "-o" "/tmp/--e22b2f.o" "-x" "c" "-"
 "/bin/ld" "--eh-frame-hdr" "-m" "elf_x86_64" "-dynamic-linker" "/lib64/ld-linux-x86-64.so.2" "-o" "/dev/null" "/usr/lib/gcc/x86_64-redhat-linux/4.8.5/../../../../lib64/crt1.o" "/usr/lib/gcc/x86_64-redhat-linux/4.8.5/../../../../lib64/crti.o" "/usr/lib/gcc/x86_64-redhat-linux/4.8.5/crtbegin.o" "-L/usr/lib/gcc/x86_64-redhat-linux/4.8.5" "-L/usr/lib/gcc/x86_64-redhat-linux/4.8.5/../../../../lib64" "-L/usr/local/bin/../lib64" "-L/lib/../lib64" "-L/usr/lib/../lib64" "-L/usr/lib/gcc/x86_64-redhat-linux/4.8.5/../../.." "-L/usr/local/bin/../lib" "-L/lib" "-L/usr/lib" "/tmp/--e22b2f.o" "-lgcc" "--as-needed" "-lgcc_s" "--no-as-needed" "-lc" "-lgcc" "--as-needed" "-lgcc_s" "--no-as-needed" "/usr/lib/gcc/x86_64-redhat-linux/4.8.5/crtend.o" "/usr/lib/gcc/x86_64-redhat-linux/4.8.5/../../../../lib64/crtn.o"
-O2 优化选项:
$echo 'int;' | clang -xc -O2 - -o /dev/null -\#\#\#
clang version 3.5.2 (tags/RELEASE_352/final)
Target: x86_64-unknown-linux-gnu
Thread model: posix
 "/usr/local/bin/clang-3.5" "-cc1" "-triple" "x86_64-unknown-linux-gnu" "-emit-obj" "-disable-free" "-disable-llvm-verifier" "-main-file-name" "-" "-mrelocation-model" "static" "-fmath-errno" "-masm-verbose" "-mconstructor-aliases" "-munwind-tables" "-fuse-init-array" "-target-cpu" "x86-64" "-momit-leaf-frame-pointer" "-dwarf-column-info" "-resource-dir" "/usr/local/bin/../lib/clang/3.5.2" "-internal-isystem" "/usr/local/include" "-internal-isystem" "/usr/local/bin/../lib/clang/3.5.2/include" "-internal-externc-isystem" "/include" "-internal-externc-isystem" "/usr/include" "-O2" "-fdebug-compilation-dir" "/data/home/gerryyang/pracing/build/release/src/gamesvr/CMakeFiles/gamesvr.dir" "-ferror-limit" "19" "-fmessage-length" "198" "-mstackrealign" "-fobjc-runtime=gcc" "-fdiagnostics-show-option" "-fcolor-diagnostics" "-vectorize-loops" "-vectorize-slp" "-o" "/tmp/--ebb79a.o" "-x" "c" "-"
 "/bin/ld" "--eh-frame-hdr" "-m" "elf_x86_64" "-dynamic-linker" "/lib64/ld-linux-x86-64.so.2" "-o" "/dev/null" "/usr/lib/gcc/x86_64-redhat-linux/4.8.5/../../../../lib64/crt1.o" "/usr/lib/gcc/x86_64-redhat-linux/4.8.5/../../../../lib64/crti.o" "/usr/lib/gcc/x86_64-redhat-linux/4.8.5/crtbegin.o" "-L/usr/lib/gcc/x86_64-redhat-linux/4.8.5" "-L/usr/lib/gcc/x86_64-redhat-linux/4.8.5/../../../../lib64" "-L/usr/local/bin/../lib64" "-L/lib/../lib64" "-L/usr/lib/../lib64" "-L/usr/lib/gcc/x86_64-redhat-linux/4.8.5/../../.." "-L/usr/local/bin/../lib" "-L/lib" "-L/usr/lib" "/tmp/--ebb79a.o" "-lgcc" "--as-needed" "-lgcc_s" "--no-as-needed" "-lc" "-lgcc" "--as-needed" "-lgcc_s" "--no-as-needed" "/usr/lib/gcc/x86_64-redhat-linux/4.8.5/crtend.o" "/usr/lib/gcc/x86_64-redhat-linux/4.8.5/../../../../lib64/crtn.o"
-O3 优化选项:
$echo 'int;' | clang -xc -O3 - -o /dev/null -\#\#\#
clang version 3.5.2 (tags/RELEASE_352/final)
Target: x86_64-unknown-linux-gnu
Thread model: posix
 "/usr/local/bin/clang-3.5" "-cc1" "-triple" "x86_64-unknown-linux-gnu" "-emit-obj" "-disable-free" "-disable-llvm-verifier" "-main-file-name" "-" "-mrelocation-model" "static" "-fmath-errno" "-masm-verbose" "-mconstructor-aliases" "-munwind-tables" "-fuse-init-array" "-target-cpu" "x86-64" "-momit-leaf-frame-pointer" "-dwarf-column-info" "-resource-dir" "/usr/local/bin/../lib/clang/3.5.2" "-internal-isystem" "/usr/local/include" "-internal-isystem" "/usr/local/bin/../lib/clang/3.5.2/include" "-internal-externc-isystem" "/include" "-internal-externc-isystem" "/usr/include" "-O3" "-fdebug-compilation-dir" "/data/home/gerryyang/pracing/build/release/src/gamesvr/CMakeFiles/gamesvr.dir" "-ferror-limit" "19" "-fmessage-length" "198" "-mstackrealign" "-fobjc-runtime=gcc" "-fdiagnostics-show-option" "-fcolor-diagnostics" "-vectorize-loops" "-vectorize-slp" "-o" "/tmp/--1ea6a8.o" "-x" "c" "-"
 "/bin/ld" "--eh-frame-hdr" "-m" "elf_x86_64" "-dynamic-linker" "/lib64/ld-linux-x86-64.so.2" "-o" "/dev/null" "/usr/lib/gcc/x86_64-redhat-linux/4.8.5/../../../../lib64/crt1.o" "/usr/lib/gcc/x86_64-redhat-linux/4.8.5/../../../../lib64/crti.o" "/usr/lib/gcc/x86_64-redhat-linux/4.8.5/crtbegin.o" "-L/usr/lib/gcc/x86_64-redhat-linux/4.8.5" "-L/usr/lib/gcc/x86_64-redhat-linux/4.8.5/../../../../lib64" "-L/usr/local/bin/../lib64" "-L/lib/../lib64" "-L/usr/lib/../lib64" "-L/usr/lib/gcc/x86_64-redhat-linux/4.8.5/../../.." "-L/usr/local/bin/../lib" "-L/lib" "-L/usr/lib" "/tmp/--1ea6a8.o" "-lgcc" "--as-needed" "-lgcc_s" "--no-as-needed" "-lc" "-lgcc" "--as-needed" "-lgcc_s" "--no-as-needed" "/usr/lib/gcc/x86_64-redhat-linux/4.8.5/crtend.o" "/usr/lib/gcc/x86_64-redhat-linux/4.8.5/../../../../lib64/crtn.o"
diff -wy --suppress-common-lines    <(echo 'int;' | clang -xc -O0   - -o /dev/null -\#\#\# 2>&1 | tr " " "\n" | grep -v /tmp)   <(echo 'int;' | clang -xc -O2 - -o /dev/null -\#\#\# 2>&1 | tr " " "\n" | grep -v /tmp)
"-mrelax-all"                                                 <
"-mdisable-fp-elim"                                           <
                                                              > "-momit-leaf-frame-pointer"
"-O0"                                                         | "-O2"
                                                              > "-vectorize-loops"
                                                              > "-vectorize-slp"
diff -wy --suppress-common-lines  \
>   <(echo 'int;' | clang -xc -O2   - -o /dev/null -\#\#\# 2>&1 | tr " " "\n" | grep -v /tmp) \
>   <(echo 'int;' | clang -xc -O3 - -o /dev/null -\#\#\# 2>&1 | tr " " "\n" | grep -v /tmp)
"-O2"                                                         | "-O3"
With version 3.5 the passes are as follow (parsed output of the command above):
- default (-O0): -targetlibinfo -verify -verify-di
- -O1 is based on -O0
- adds: -correlated-propagation -basiccg -simplifycfg -no-aa -jump-threading -sroa -loop-unswitch -ipsccp -instcombine -memdep -memcpyopt -barrier -block-freq -loop-simplify -loop-vectorize -inline-cost -branch-prob -early-cse -lazy-value-info -loop-rotate -strip-dead-prototypes -loop-deletion -tbaa -prune-eh -indvars -loop-unroll -reassociate -loops -sccp -always-inline -basicaa -dse -globalopt -tailcallelim -functionattrs -deadargelim -notti -scalar-evolution -lower-expect -licm -loop-idiom -adce -domtree -lcssa
- -O2 is based on -01
- adds: -gvn -constmerge -globaldce -slp-vectorizer -mldst-motion -inline
- removes: -always-inline
- -O3 is based on -O2
- adds: -argpromotion
- -Os is identical to -O2
- -Oz is based on -Os
- removes: -slp-vectorizer
Extensions for selectively disabling optimization
Clang provides a mechanism for selectively disabling optimizations in functions and methods.
To disable optimizations in a single function definition, the GNU-style or C++11 non-standard attribute optnone can be used.
// The following functions will not be optimized.
// GNU-style attribute
__attribute__((optnone)) int foo() {
  // ... code
}

// C++11 attribute
[[clang::optnone]] int bar() {
  // ... code
}
To facilitate disabling optimization for a range of function definitions, a range-based pragma is provided. Its syntax is #pragma clang optimize followed by off or on.
All function definitions in the region between an off and the following on will be decorated with the optnone attribute unless doing so would conflict with explicit attributes already present on the function (e.g. the ones that control inlining).
#pragma clang optimize off
// This function will be decorated with optnone.
int foo() {
  // ... code
}

// optnone conflicts with always_inline, so bar() will not be decorated.
__attribute__((always_inline)) int bar() {
  // ... code
}
#pragma clang optimize on
If no on is found to close an off region, the end of the region is the end of the compilation unit.
Note that a stray #pragma clang optimize on does not selectively enable additional optimizations when compiling at low optimization levels. This feature can only be used to selectively disable optimizations.
clang ignoring attribute noinline
I expected __attribute__((noinline)), when added to a function, to make sure that that function gets emitted. This works with gcc, but clang still seems to inline it.
Here is an example, which you can also open on Godbolt:
namespace {

__attribute__((noinline))
int inner_noinline() {
    return 3;
}

int inner_inline() {
    return 4;
}

int outer() {
    return inner_noinline() + inner_inline();
}

}

int main() {
    return outer();
}
When build with -O3, gcc emits inner_noinline, but not inner_inline:
(anonymous namespace)::inner_noinline():
        mov     eax, 3
        ret
main:
        call    (anonymous namespace)::inner_noinline()
        add     eax, 4
        ret
Clang insists on inlining it:
main: # @main
  mov eax, 7
  ret
If adding a parameter to the functions and letting them perform some trivial work, clang respects the noinline attribute: https://godbolt.org/z/NNSVab
Shouldn’t noinline be independent of how complex the function is? What am I missing?
Answers:
Does clang support noinline attribute?
It doesn’t have its own category in the list of attributes, but if you search for noinline there, you will find it mentioned several times.
Also, looking at the version with parameters, if I remove it there, both functions are inlined. So clang seems to at least know it.
related: noinline attribute is not respected in -O1 and above #3409
__attribute__((noinline)) prevents the compiler from inlining the function. It doesn’t prevent it from doing constant folding. In this case, the compiler was able to recognize that there was no need to call inner_noinline, either as an inline insertion or an out-of-line call. It could just replace the function call with the constant 3.
It sounds like you want to use the optnone attribute instead, to prevent the compiler from applying even the most obvious of optimizations (as this one is).
Options for Debugging Your Program - GCC - 调试相关的编译选项
To tell GCC to emit extra information for use by a debugger, in almost all cases you need only to add -g to your other options. Some debug formats can co-exist (like DWARF with CTF) when each of them is enabled explicitly by adding the respective command line option to your other options.
GCC allows you to use -g with -O. The shortcuts taken by optimized code may occasionally be surprising: some variables you declared may not exist at all; flow of control may briefly move where you did not expect it; some statements may not be executed because they compute constant results or their values are already at hand; some statements may execute in different places because they have been moved out of loops. Nevertheless it is possible to debug optimized output. This makes it reasonable to use the optimizer for programs that might have bugs.
If you are not using some other optimization option, consider using -Og (see Options That Control Optimization) with -g. With no -O option at all, some compiler passes that collect information useful for debugging do not run at all, so that -Og may result in a better debugging experience.
-g
Produce debugging information in the operating system’s native format (stabs, COFF, XCOFF, or DWARF). GDB can work with this debugging information.
On most systems that use stabs format, -g enables use of extra debugging information that only GDB can use; this extra information makes debugging work better in GDB but probably makes other debuggers crash or refuse to read the program. If you want to control for certain whether to generate the extra information, use -gvms (see below).
-ggdb
Produce debugging information for use by GDB. This means to use the most expressive format available (DWARF, stabs, or the native format if neither of those are supported), including GDB extensions if at all possible.
-gdwarf / -gdwarf-version
Produce debugging information in DWARF format (if that is supported). The value of version may be either 2, 3, 4 or 5; the default version for most targets is 5 (with the exception of VxWorks, TPF and Darwin/Mac OS X, which default to version 2, and AIX, which defaults to version 4).
Note that with DWARF Version 2, some ports require and always use some non-conflicting DWARF 3 extensions in the unwind tables.
Version 4 may require GDB 7.0 and -fvar-tracking-assignments for maximum benefit. Version 5 requires GDB 8.0 or higher.
Include What You Use (A tool for use with clang to analyze #includes in C and C++ source files)
Here, the main benefit of include-what-you-use comes from the flip side: “don’t include what you don’t use.”
参考:https://github.com/include-what-you-use/include-what-you-use/blob/master/docs/WhyIWYU.md
- 更快的编译。当
cpp文件包含冗余头文件时,编译器会读取、预处理和解析更多的代码,如果有模板存在,则会引入更多的代码,这会加大编译构建时间。 - 更好的重构。假如准备重构
foo.h,使得它不再使用vector,很可能会从foo.h文件中移除#include<vector>。理论上可以这么做,但实际上不行,因为其他文件可能会通过foo.h来间接引用vector,贸然移除会造成其他文件编译失败。iwyu 工具可以找到并去掉这种间接引用。 - 头文件自注释。通过查看必须头文件注释,可知道该功能依赖于其他哪些子功能。
- 使用前向声明代替 include 语句,减少依赖,减少可执行程序大小。
Since some coding standards have taken to discourage forward declarations, IWYU has grown a
--no_fwd_declsmode to embrace this alternative strategy. Where IWYU’s default behavior is to minimize the number of include directives, IWYU with--no_fwd_declswill attempt to minimize the number of times each type is redeclared. The result is that include directives will always be preferred over local forward declarations, even if it means including a header just for a name-only type declaration.
For more in-depth documentation, see docs.
NOTE: Include-what-you-use makes heavy use of Clang internals, and will occasionally break when Clang is updated. We build IWYU regularly against Clang mainline to detect and fix such compatibility breaks as soon as possible.
Build
How to build standalone
This build mode assumes you already have compiled LLVM and Clang libraries on your system, either via packages for your platform or built from source. To set up an environment for building IWYU:
- Create a directory for IWYU development, e.g.
iwyu - Clone the IWYU Git repo:
iwyu$ git clone https://github.com/include-what-you-use/include-what-you-use.git
- Presumably, you’ll be building IWYU with a released version of LLVM and Clang, so check out the corresponding branch. For example, if you have Clang 6.0 installed, use the
clang_6.0branch. IWYUmastertracks LLVM & Clangmain:
iwyu$ cd include-what-you-use
iwyu/include-what-you-use$ git checkout clang_6.0
- Create a build root and use CMake to generate a build system linked with LLVM/Clang prebuilts:
# This example uses the Makefile generator, but anything should work.
iwyu/include-what-you-use$ cd ..
iwyu$ mkdir build && cd build

# For IWYU 0.10/Clang 6 and earlier
iwyu/build$ cmake -G "Unix Makefiles" -DIWYU_LLVM_ROOT_PATH=/usr/lib/llvm-6.0 ../include-what-you-use

# For IWYU 0.11/Clang 7 and later
iwyu/build$ cmake -G "Unix Makefiles" -DCMAKE_PREFIX_PATH=/usr/lib/llvm-7 ../include-what-you-use
(substitute the llvm-6.0 or llvm-7 suffixes with the actual version compatible with your IWYU branch)
or, if you have a local LLVM and Clang build tree, you can specify that as CMAKE_PREFIX_PATH for IWYU 0.11 and later:
iwyu/build$ cmake -G "Unix Makefiles" -DCMAKE_PREFIX_PATH=~/llvm-project/build ../include-what-you-use
- Once CMake has generated a build system, you can invoke it directly from
build, e.g.
iwyu/build$ make
How to build as part of LLVM
Instructions for building LLVM and Clang are available at https://clang.llvm.org/get_started.html.
To include IWYU in the LLVM build, use the LLVM_EXTERNAL_PROJECTS and LLVM_EXTERNAL_*_SOURCE_DIR CMake variables when configuring LLVM:
llvm-project/build$ cmake -G "Unix Makefiles" -DLLVM_ENABLE_PROJECTS=clang -DLLVM_EXTERNAL_PROJECTS=iwyu -DLLVM_EXTERNAL_IWYU_SOURCE_DIR=/path/to/iwyu /path/to/llvm-project/llvm
llvm-project/build$ make
This builds all of LLVM, Clang and IWYU in a single tree.
Usage
$include-what-you-use --help
USAGE: include-what-you-use [-Xiwyu --iwyu_opt]... <clang opts> <source file>
Here are the <iwyu_opts> you can specify (e.g. -Xiwyu --verbose=3):
   --check_also=<glob>: tells iwyu to print iwyu-violation info
        for all files matching the given glob pattern (in addition
        to the default of reporting for the input .cc file and its
        associated .h files).  This flag may be specified multiple
        times to specify multiple glob patterns.
   --keep=<glob>: tells iwyu to always keep these includes.
        This flag may be specified multiple times to specify
        multiple glob patterns.
   --mapping_file=<filename>: gives iwyu a mapping file.
   --no_default_mappings: do not add iwyu's default mappings.
   --pch_in_code: mark the first include in a translation unit as a
        precompiled header.  Use --pch_in_code to prevent IWYU from
        removing necessary PCH includes.  Though Clang forces PCHs
        to be listed as prefix headers, the PCH-in-code pattern can
        be used with GCC and is standard practice on MSVC
        (e.g. stdafx.h).
   --prefix_header_includes=<value>: tells iwyu what to do with
        in-source includes and forward declarations involving
        prefix headers.  Prefix header is a file included via
        command-line option -include.  If prefix header makes
        include or forward declaration obsolete, presence of such
        include can be controlled with the following values
          add:    new lines are added
          keep:   new lines aren't added, existing are kept intact
          remove: new lines aren't added, existing are removed
        Default value is 'add'.
   --transitive_includes_only: do not suggest that a file add
        foo.h unless foo.h is already visible in the file's
        transitive includes.
   --max_line_length: maximum line length for includes.
        Note that this only affects comments and alignment thereof,
        the maximum line length can still be exceeded with long
        file names (default: 80).
   --no_comments: do not add 'why' comments.
   --no_fwd_decls: do not use forward declarations.
   --verbose=<level>: the higher the level, the more output.
   --quoted_includes_first: when sorting includes, place quoted
        ones first.
   --cxx17ns: suggests the more concise syntax introduced in C++17

In addition to IWYU-specific options you can specify the following
options without -Xiwyu prefix:
   --help: prints this help and exits.
   --version: prints version and exits.
Running on single source file
The simplest way to use IWYU is to run it against a single source file:
include-what-you-use $CXXFLAGS myfile.cc
where $CXXFLAGS are the flags you would normally pass to the compiler.
Plugging into existing build system
Typically there is already a build system containing the relevant compiler flags for all source files. Replace your compiler with include-what-you-use to generate a large batch of IWYU advice. Depending on your build system/build tools, this can take many forms, but for a simple GNU Make system it might look like this:
make -k CXX=include-what-you-use CXXFLAGS="-Xiwyu --error_always"
The additional
-Xiwyu --error_alwaysswitch makesinclude-what-you-usealways exit with an error code, so the build system knows it didn’t build a .o file. Hence the need for-k.
In this mode include-what-you-use only analyzes the .cc (or .cpp) files known to your build system, along with their corresponding .h files. If your project has a .h file with no corresponding .cc file, IWYU will ignore it unless you use the --check_also switch to add it for analysis together with a .cc file. It is possible to run IWYU against individual header files, provided the compiler flags are carefully constructed to match all includers.
Using with CMake
CMake has grown native support for IWYU as of version 3.3. See their documentation for CMake-side details.
New in version 3.3.

This property is implemented only when <LANG> is C or CXX.

Specify a semicolon-separated list containing a command line for the include-what-you-use tool. The Makefile Generators and the Ninja generator will run this tool along with the compiler and report a warning if the tool reports any problems.
The CMAKE_CXX_INCLUDE_WHAT_YOU_USE option enables a mode where CMake first compiles a source file, and then runs IWYU on it.
Use it like this:
mkdir build && cd build
CC="clang" CXX="clang++" cmake -DCMAKE_CXX_INCLUDE_WHAT_YOU_USE=include-what-you-use ...
These examples assume that include-what-you-use is in the PATH. If it isn’t, consider changing the value to an absolute path. Arguments to IWYU can be added using CMake’s semicolon-separated list syntax, e.g.:
... cmake -DCMAKE_CXX_INCLUDE_WHAT_YOU_USE="include-what-you-use;-w;-Xiwyu;--verbose=7" ...
The option appears to be separately supported for both C and C++, so use CMAKE_C_INCLUDE_WHAT_YOU_USE for C code.
Using with a compilation database
The iwyu_tool.py script pre-dates the native CMake support, and works off the compilation database format. For example, CMake generates such a database named compile_commands.json with the CMAKE_EXPORT_COMPILE_COMMANDS option enabled.
The script’s command-line syntax is designed to mimic Clang’s LibTooling, but they are otherwise unrelated. It can be used like this:
mkdir build && cd build
CC="clang" CXX="clang++" cmake -DCMAKE_EXPORT_COMPILE_COMMANDS=ON ...
iwyu_tool.py -p .
Unless a source filename is provided, all files in the project will be analyzed.
See iwyu_tool.py --help for more options.
Applying fixes
We also include a tool that automatically fixes up your source files based on the IWYU recommendations. This is also alpha-quality software! Here’s how to use it (requires python3):
make -k CXX=include-what-you-use CXXFLAGS="-Xiwyu --error_always" 2> /tmp/iwyu.out
python3 fix_includes.py < /tmp/iwyu.out
If you don’t like the way fix_includes.py munges your #include lines, you can control its behavior via flags. fix_includes.py --help will give a full list, but these are some common ones:
-b: Put blank lines between system and Google includes--nocomments: Don’t add the ‘why’ comments next to includes
Which pragma should I use?
Ideally, IWYU should be smart enough to understand your intentions (and intentions of the authors of libraries you use), so the first answer should always be: none.
In practice, intentions are not so clear – it might be ambiguous whether an #include is there by clever design or by mistake, whether an #include serves to export symbols from a private header through a public facade or if it’s just a left-over after some clean-up. Even when intent is obvious, IWYU can make mistakes due to bugs or not-yet-implemented policies.
IWYU pragmas have some overlap, so it can sometimes be hard to choose one over the other. Here’s a guide based on how I understand them at the moment:
- Use
IWYU pragma: keepto force IWYU to keep any#includedirective that would be discarded under its normal policies. - Use
IWYU pragma: always_keepto force IWYU to keep a header in all includers, whether they contribute any used symbols or not. - Use
IWYU pragma: exportto tell IWYU that one header serves as the provider for all symbols in another, included header (e.g. facade headers). UseIWYU pragma: begin_exports/end_exportsfor a whole group of included headers. - Use
IWYU pragma: no_includeto tell IWYU that the file in which the pragma is defined should never#includea specific header (the header may already be included via some other#include.) - Use
IWYU pragma: no_forward_declareto tell IWYU that the file in which the pragma is defined should never forward-declare a specific symbol (a forward declaration may already be available via some other#include.) - Use
IWYU pragma: privateto tell IWYU that the header in which the pragma is defined is private, and should not be included directly. - Use
IWYU pragma: private, include "public.h"to tell IWYU that the header in which the pragma is defined is private, andpublic.hshould always be included instead. - Use
IWYU pragma: friend ".*favorites.*"to overrideIWYU pragma: privateselectively, so that a set of files identified by a regex can include the file even if it’s private.
The pragmas come in three different classes;
- Ones that apply to a single
#includedirective (keep,export) - Ones that apply to a file being included (
private,friend,always_keep) - Ones that apply to a file including other headers (
no_include,no_forward_declare)
Some files are both included and include others, so it can make sense to mix and match.
Why include-what-you-use is difficult
This section is informational, for folks who are wondering why include-what-you-use requires so much code and yet still has so many errors.
Include-what-you-use has the most problems with templates and macros. If your code doesn’t use either, IWYU will probably do great. And, you’re probably not actually programming in C++…
BOLT (链接后优化技术)
关于 BOLT 优化参考:
- https://github.com/llvm/llvm-project/tree/main/bolt
- https://zhuanlan.zhihu.com/p/550895670
- BOLT 二进制反馈优化技术
BOLT is a post-link optimizer developed to speed up large applications. It achieves the improvements by optimizing application’s code layout based on execution profile gathered by sampling profiler, such as Linux perf tool. An overview of the ideas implemented in BOLT along with a discussion of its potential and current results is available in CGO’19 paper.
大型应用的代码往往达到数十甚至上百 MB,这导致在程序执行时缓存机制无法充分利用,导致大量时间花费在 CPU 和内存链路上。通过对热点函数的布局进行优化,我们可以更好地利用 CPU cache,从而获得较为可观的性能提升。针对这一问题,在编译技术上有 PGO 和 BOLT 两种解决办法,两者都是一种通过收集程序在运行时如跳转,调用关系,函数热度等执行信息,这些收集到的程序运行情况数据(profile data),可以更好地指导一些程序优化的策略,如是否对函数进行内联,以及对基本块和函数布局的排布来提高特定场景下的程序性能。
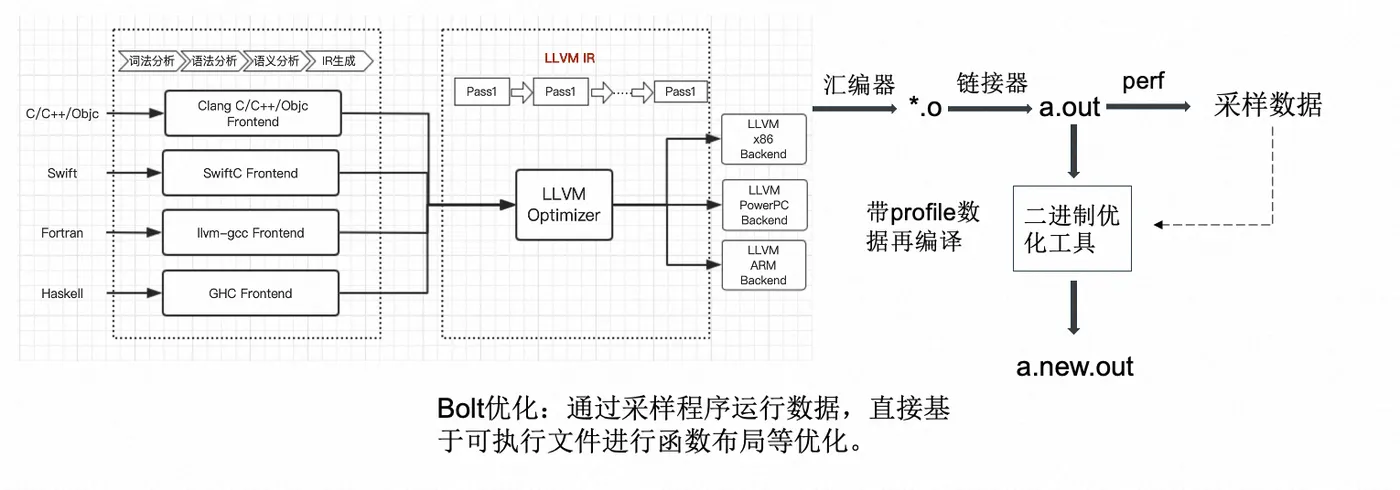
PGO 和 BOLT 两种方式都是基于收集到程序运行数据进行优化,但存在一定差异。不同于 PGO 通过编译器进行再次编译,BOLT 是一个二进制优化和布局工具,直接对可执行文件或动态库 ELF 文件进行解析和进行修改,无需再次通过编译器进行构建。
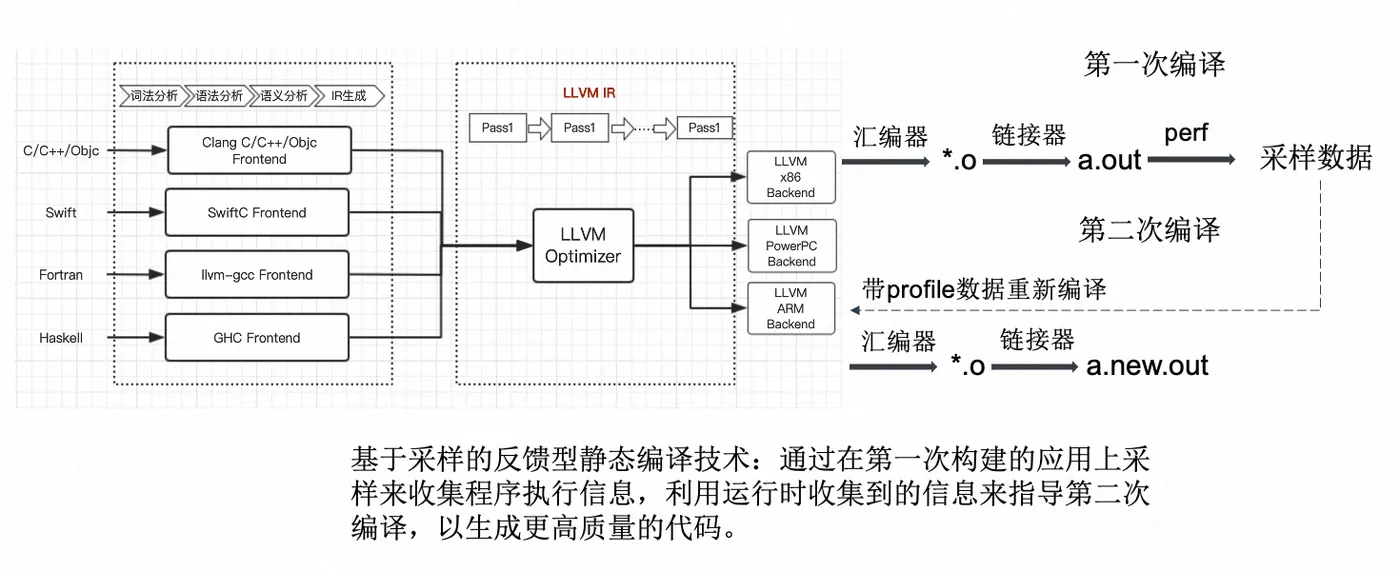
PGO 的优化原理:
BOLT 的优化原理:
在业务落地和优化结果方面,BOLT 和 PGO 主要有以下两个方面的区别。
- BOLT 在函数和基本块布局上能拿到更好的效果
编译器对函数的布局通常都是在编译优化的最后一步。在使用 PGO 的过程中,一个无法避免的问题就是函数内联等优化会导致上下文发生变化进而收集数据不准确,尤其是基本块排布需要的分支概率。而 BOLT 避免了 callsite 等信息的改动,专注于函数和函数内部的排布进行优化,可以得到更好的效果。
因此,BOLT 和 PGO 在编译优化方法中并不是互斥的,是可以相互弥补的。在实践中,PGO 和 BOLT 的优化在很多场景下是可以串联的,同时使用可以获得更好的性能收益。
- BOLT 在有大型项目的部署会更加友好
这里的部署友好主要体现在三个方面:
- 更容易被集成到应用的构建系统中。
BOLT在构建脚本中无需重复编译器的编译流程,这对于很多构建方式复杂的应用方来说构建修改更加友好,更方便落地。 - 更快地构建速度。无需重复编译也意味着通过
BOLT进行优化能拿到比PGO更快的构建速度,比如编译器构建一次要 20-30 分钟的 Clang 使用 BOLT 只需要 20~30秒。这对于单次编译就长达数小时的应用来说显然更容易接受。 - BOLT 可以对第三方的静态库进行优化。大型应用中往往很多第三方库的依赖,
BOLT的好处之一就是可以对静态链接进来的第三方库进行优化,而PGO则需要对第三方库逐个重新构建,在直接依赖于第三方静态库的场景中无法使用。
关于 BOLT 的更多介绍:
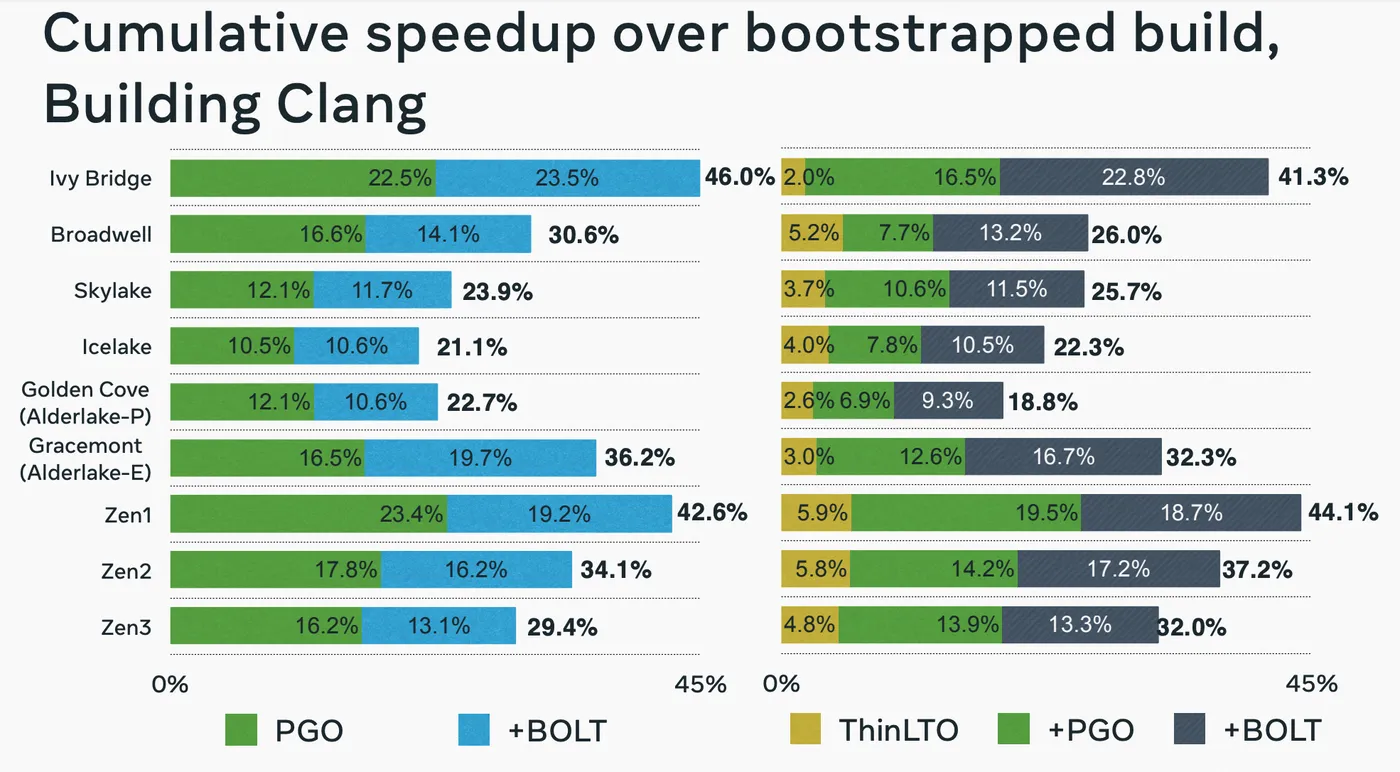
优化代码布局 (code layout) 是一项对于性能提升的重要优化,目前在编译时和链接时都有对应可行的优化手段。而 BOLT (Binary Optimization and Layout Tool) 则是链接后优化 (post-link optimizer),使用基于采样的 profile 信息,甚至可以对已经进行过 FDO (feedback-driven optimization) 和 LTO (link-time optimization) 之后的二进制再次提升其运行性能,所以这是一个可作为补充的优化手段。根据论文中测试数据,在 FDO 和 LTO 基础上,提升了 GCC 和 Clang 编译器 20.4% 的性能。还可以用来优化没有源码的第三方库。
BOLT 是 facebook 推出的优化工具,目前 BOLT 已经合进去 LLVM 仓库作为一部分,具体使用有官方文档,不展开介绍了。
对于以数据中心驱动的应用而言,提升代码的局部性是优化性能的关键。FDO 也可称之为 PGO (profile-guided optimization)。instrumentation-based PGO 在插桩 (probe) 收集 profile 信息阶段会带来巨大的内存和性能消耗,其复杂的操作流程也导致其难以施行。所以 BOLT 采取 sampling-based PGO 的方式,使用诸如 perf 工具进行数据采样,减少了方案实行的复杂度,同时也减少了内存与性能消耗。
而且 BOLT 是在对链接后的二进制层面做优化,相对于 PGO 在编译期和链接期的机器码生成之前阶段的操作,也会更加简单,和 LTO 同样拥有整个程序的全局视角来做优化。因为要优化代码布局,在低层级 (low-level) 优化中,sampling-based PGO 的 profile 信息也是基于二进制层面的,准确度和匹配程度也会更高。所以即使经过 LTO 和 PGO 的优化,BOLT 的优势就在于在二进制层面还有优化空间,而且 profile 的准确度和匹配程度也较高。准确度和匹配程度是很重要的,因为使用不准确的 profile 甚至可能会导致性能倒退,而不匹配的 profile 则会导致错失一些优化机会。
BOLT 会跳过那些它无法处理的函数,比如比较复杂的还未支持的函数、无法重建 CFG (control-flow graph,控制流图) 的函数。而且可能会带来代码体积的增加,因为 cold paths (执行频次较小的路径) 的 branch (分支跳转) 会变多 (基于 profile 可以判断 cold code,通常会被转移到其他地方,所以需要添加跳转执行的指令,这样也有效地提升内存使用率);而且 x86 架构的 conditional branch (条件分支跳转) 指令有个特点,带符号偏移量 (signed offset) 如果只用 8-bit 会需要 2-bytes,而如果要用 32-bit 则需要 6-bytes。
BOLT 在一个进程当中完成反汇编、优化、重写二进制的操作,所以它存在一些问题:无法有效利用分布式编译系统,重写 300MB 的代码段可能需要 70G 的内存和长达 10 分钟的时间。
编译二进制大小优化
在使用 Clang 编译器时,有多种方法可以优化生成的二进制文件大小。以下是一些建议:
- 优化级别:使用
-Os或-Oz优化选项。这些选项专门针对生成较小的二进制文件进行优化。
clang -Os -o output_file input_file.c
或者
clang -Oz -o output_file input_file.c
-
去除调试信息:如果不需要调试信息,请确保不使用
-g选项。如果需要调试信息,但希望减小文件大小,可以考虑使用-Wl,--compress-debug-sections=zlib将调试信息压缩。 -
链接时优化(LTO):使用链接时优化可以在链接阶段进行更多优化,这可能有助于减小生成的二进制文件大小。要启用 LTO,请使用
-flto选项.
clang -flto -Os -o output_file input_file.c
- 去除未使用的代码和数据:使用
-ffunction-sections和-fdata-sections选项将函数和数据放入单独的节(section),然后使用链接器选项--gc-sections删除未使用的节:
clang -Os -ffunction-sections -fdata-sections -o output_file input_file.c -Wl,--gc-sections
-
静态链接:尽量避免静态链接,因为它会将库的整个内容包含到二进制文件中。相反,使用动态链接可以减小二进制文件大小。
-
符号剥离:使用
strip工具删除不必要的符号信息。这不仅可以减小二进制文件大小,还可以防止其他人轻松地逆向工程您的代码。在编译完成后,运行以下命令:
strip output_file
请注意,这将删除所有符号信息,使调试变得困难。因此,仅在不需要调试信息时执行此操作。
- 代码优化:在源代码级别进行优化。例如,删除不必要的代码,减少全局变量的使用,使用更小的数据类型等。
通过结合使用这些技巧,可以在使用 Clang 编译器时优化生成的二进制文件大小。请注意,某些优化可能会影响程序的性能和可调试性,因此在选择优化方法时要权衡利弊。
删除不使用的 Dead Codes (-fdata-sections / -ffunction-sections / -Wl,–gc-sections)
参考Compilation options通过下面两步,去除代码没有使用的函数:
- 添加编译选项
CFLAGS += -fdata-sections -ffunction-sections - 添加链接选项
-Wl,--gc-sections
通过上面两步,会将函数代码生成为独立的section,并在链接的时候去除不用的Dead Codes。
注意:此选项对gcc和clang都生效。
$readelf -t demo.o
There are 26 section headers, starting at offset 0x10b0:

Section Headers:
  [Nr] Name
       Type              Address          Offset            Link
       Size              EntSize          Info              Align
       Flags
  [ 0]
       NULL                   NULL             0000000000000000  0000000000000000  0
       0000000000000000 0000000000000000  0                 0
       [0000000000000000]:
  [ 1] .text
       PROGBITS               PROGBITS         0000000000000000  0000000000000040  0
       0000000000000000 0000000000000000  0                 4
       [0000000000000006]: ALLOC, EXEC
  [ 2] .data
       PROGBITS               PROGBITS         0000000000000000  0000000000000040  0
       0000000000000000 0000000000000000  0                 4
       [0000000000000003]: WRITE, ALLOC
  [ 3] .bss
       NOBITS                 NOBITS           0000000000000000  0000000000000040  0
       0000000000000000 0000000000000000  0                 4
       [0000000000000003]: WRITE, ALLOC
  [ 4] .text._Z4funcv
       PROGBITS               PROGBITS         0000000000000000  0000000000000040  0
       0000000000000010 0000000000000000  0                 1
       [0000000000000006]: ALLOC, EXEC
  [ 5] .text._Z5func2v
       PROGBITS               PROGBITS         0000000000000000  0000000000000050  0
       0000000000000010 0000000000000000  0                 1
       [0000000000000006]: ALLOC, EXEC
  [ 6] .rodata
       PROGBITS               PROGBITS         0000000000000000  0000000000000060  0
       0000000000000007 0000000000000000  0                 1
       [0000000000000002]: ALLOC
  [ 7] .text.main
       PROGBITS               PROGBITS         0000000000000000  0000000000000067  0
       0000000000000049 0000000000000000  0                 1
       [0000000000000006]: ALLOC, EXEC
  [ 8] .rela.text.main
       RELA                   RELA             0000000000000000  0000000000001970  24
       0000000000000048 0000000000000018  7                 8
       [0000000000000000]:
  [ 9] .debug_info
       PROGBITS               PROGBITS         0000000000000000  00000000000000b0  0
       000000000000076f 0000000000000000  0                 1
       [0000000000000000]:

...
并且最终的链接代码中,不会存在未使用函数的代码:
$nm -C demo | grep func
00000000004005f0 T func()
查看mapfile,可以看到func2被discard了:
Discarded input sections
...
 .text          0x0000000000000000        0x0 demo.o
 .data          0x0000000000000000        0x0 demo.o
 .bss           0x0000000000000000        0x0 demo.o
 .text._Z5func2v
                0x0000000000000000       0x10 demo.o
...
$objdump -s -j .text._Z5func2v demo.o

demo.o:     file format elf64-x86-64

Contents of section .text._Z5func2v:
 0000 554889e5 c745fc04 0000008b 45fc5dc3  UH...E......E.].
refer:
- https://stackoverflow.com/questions/6687630/how-to-remove-unused-c-c-symbols-with-gcc-and-ld
- https://stackoverflow.com/questions/54996229/is-ffunction-sections-fdata-sections-and-gc-sections-not-working
- https://stackoverflow.com/questions/17710024/clang-removing-dead-code-during-static-linking-gcc-equivalent-of-wl-gc-sect
strip
strip用于删除目标文件中的符号(Discard symbols from object files),通常用于删除已生成的可执行文件和库中不需要的符号。- 在想要减少文件的大小,并保留对调试有用的信息时,使用
-d选项,可以删除不使用的信息(文件名和行号等),并可以保留函数名等一般的符号,用gdb进行调试时,只要保留了函数名,即便不知道文件名和行号,也可以进行调试。 - 使用
-R选项,是可删除其他任意信息的选项,在执行strip -R .text demo1后,程序的text部分(代码部分)会被完全删除,从而导致程序的无法运行。 - 实际上,对
.o文件以及.a文件使用strip后,就不能进行和其他目标文件的链接操作。这是由于文件对链接器符号有依赖性,所以最好不要从.o和.a文件中删除符号。 - 对release的版本strip,当用户环境产生coredump后,可以通过包含调试信息的开发版本在开发环境进行调试。
- 虽然在磁盘容量足够大的PC中,可能不会出现想要将可执行文件变小的情况。但在容量有限的环境,或想要通过网络复制并运行程序时,
strip却是一个方便的工具。
# 去除目标文件中的符号
$ strip objfile
$ nm objfile
nm: objfile: no symbols

# 删除代码段
$ strip -R .text demo1
$ ./demo1
Segmentation fault (core dumped)
objcopy (分离调试信息)
objcopy- copy and translate object file- 实际上,在
objcopy上使用-strip-*选项后也能进行与strip同样的处理。
例如:
# 拷贝出一个符号表文件
$ objcopy --only-keep-debug mainO3 mainO3.symbol

# 拷贝出一个不包含调试信息的执行文件
$ objcopy --strip-debug mainO3 mainO3.bin

$ objcopy --add-gnu-debuglink=mainO3.symbol mainO3
- 用
objcopy嵌入可执行文件的数据,objcopy可以将任意文件转换为可以链接的目标文件。
例如:可以将foo.jpg转换为x86用的ELF32形式的目标文件foo.o
$ objcopy -I binary -O elf32-i386 -B i386 foo.jpg foo.o
脚本工具:
#!/bin/bash

scriptdir=`dirname ${0}`
scriptdir=`(cd ${scriptdir}; pwd)`
scriptname=`basename ${0}`

set -e

function errorexit()
{
  errorcode=${1}
  shift
  echo $@
  exit ${errorcode}
}

function usage()
{
  echo "USAGE ${scriptname} <tostrip>"
}

tostripdir=`dirname "$1"`
tostripfile=`basename "$1"`


if [ -z ${tostripfile} ] ; then
  usage
  errorexit 0 "tostrip must be specified"
fi

cd "${tostripdir}"

debugdir=.debug
debugfile="${tostripfile}.debug"

if [ ! -d "${debugdir}" ] ; then
  echo "creating dir ${tostripdir}/${debugdir}"
  mkdir -p "${debugdir}"
fi
echo "stripping ${tostripfile}, putting debug info into ${debugfile}"
objcopy --only-keep-debug "${tostripfile}" "${debugdir}/${debugfile}"
strip --strip-debug --strip-unneeded "${tostripfile}"
objcopy --add-gnu-debuglink="${debugdir}/${debugfile}" "${tostripfile}"
chmod -x "${debugdir}/${debugfile}"
refer: How to generate gcc debug symbol outside the build target?
LLVM Link Time Optimization: Design and Implementation - LTO
使用 LTO 通过牺牲更多的编译时间,通过跨模块的上下文信息,实现编译优化。
由于编译器一次只编译优化一个编译单元,所以只是在做局部优化,而利用 LTO,利用链接时的全局视角进行操作,从而得到能够进行更加极致的优化。
跨模块优化的效果,也即开启 LTO 主要有这几点好处:
- 将一些函数內联化
- 去除了一些无用代码
- 对程序有全局的优化作用
比较体验不好的是,LTO 会导致编译和链接变慢,以及会使用更多的内存,所以即使到现在,也没有看到 LTO 被广泛地使用。
- 代码优化利器 LTO 介绍
- 开启Link Time Optimization(LTO)后到底有什么优化?
- Link Time Optimizations: New Way to Do Compiler Optimizations
- ThinLTO: Scalable and Incremental LTO
- LTO with LLVM and CMake
- Clang: How to check if LTO was performed
Description
LLVM features powerful intermodular optimizations which can be used at link time. Link Time Optimization (LTO) is another name for intermodular optimization when performed during the link stage. This document describes the interface and design between the LTO optimizer and the linker.
Design Philosophy
The LLVM Link Time Optimizer provides complete transparency, while doing intermodular optimization, in the compiler tool chain. Its main goal is to let the developer take advantage of intermodular optimizations without making any significant changes to the developer’s makefiles or build system. This is achieved through tight integration with the linker. In this model, the linker treats LLVM bitcode files like native object files and allows mixing and matching among them. The linker uses libLTO, a shared object, to handle LLVM bitcode files. This tight integration between the linker and LLVM optimizer helps to do optimizations that are not possible in other models. The linker input allows the optimizer to avoid relying on conservative escape analysis.
Example of link time optimization
The following example illustrates the advantages of LTO’s integrated approach and clean interface. This example requires a system linker which supports LTO through the interface described in this document. Here, clang transparently invokes system linker.
- Input source file
a.cis compiled into LLVM bitcode form. - Input source file
main.cis compiled into native object code.
--- a.h ---
extern int foo1(void);
extern void foo2(void);
extern void foo4(void);

--- a.c ---
#include "a.h"

static signed int i = 0;

void foo2(void) {
  i = -1;
}

static int foo3() {
  foo4();
  return 10;
}

int foo1(void) {
  int data = 0;

  if (i < 0)
    data = foo3();

  data = data + 42;
  return data;
}

--- main.c ---
#include <stdio.h>
#include "a.h"

void foo4(void) {
  printf("Hi\n");
}

int main() {
  return foo1();
}
To compile, run:
% clang -flto -c a.c -o a.o        # <-- a.o is LLVM bitcode file
% clang -c main.c -o main.o        # <-- main.o is native object file
% clang -flto a.o main.o -o main   # <-- standard link command with -flto
- In this example, the linker recognizes that
foo2()is an externally visible symbol defined in LLVM bitcode file. The linker completes its usual symbol resolution pass and finds thatfoo2()is not used anywhere. This information is used by the LLVM optimizer and it removesfoo2(). - As soon as
foo2()is removed, the optimizer recognizes that conditioni < 0is alwaysfalse, which meansfoo3()is never used. Hence, the optimizer also removesfoo3(). - And this in turn, enables linker to remove
foo4().
This example illustrates the advantage of tight integration with the linker. Here, the optimizer can not remove foo3() without the linker’s input.
Alternative Approaches
- Compiler driver invokes link time optimizer separately.
In this model the link time optimizer is not able to take advantage of information collected during the linker’s normal symbol resolution phase. In the above example, the optimizer can not remove foo2() without the linker’s input because it is externally visible. This in turn prohibits the optimizer from removing foo3().
- Use separate tool to collect symbol information from all object files.
In this model, a new, separate, tool or library replicates the linker’s capability to collect information for link time optimization. Not only is this code duplication difficult to justify, but it also has several other disadvantages. For example, the linking semantics and the features provided by the linker on various platform are not unique. This means, this new tool needs to support all such features and platforms in one super tool or a separate tool per platform is required. This increases maintenance cost for link time optimizer significantly, which is not necessary. This approach also requires staying synchronized with linker developments on various platforms, which is not the main focus of the link time optimizer. Finally, this approach increases end user’s build time due to the duplication of work done by this separate tool and the linker itself.
Multi-phase communication between libLTO and linker
The linker collects information about symbol definitions and uses in various link objects which is more accurate than any information collected by other tools during typical build cycles. The linker collects this information by looking at the definitions and uses of symbols in native .o files and using symbol visibility information. The linker also uses user-supplied information, such as a list of exported symbols. LLVM optimizer collects control flow information, data flow information and knows much more about program structure from the optimizer’s point of view. Our goal is to take advantage of tight integration between the linker and the optimizer by sharing this information during various linking phases.
问题
-fdebug-types-section
When using DWARF Version 4 or higher, type DIEs can be put into their own .debug_types section instead of making them part of the .debug_info section. It is more efficient to put them in a separate comdat section since the linker can then remove duplicates. But not all DWARF consumers support .debug_types sections yet and on some objects .debug_types produces larger instead of smaller debugging information.
-fdebug-types-section 选项用于在生成 DWARF 调试信息时将类型定义(type DIEs)放入单独的 .debug_types 节中,而不是将它们作为 .debug_info 节的一部分。这个选项适用于 DWARF 版本4及更高版本。
将类型定义放入单独的 .debug_types 节有以下优势:
链接器效率:链接器可以通过合并重复的类型定义来减小生成的调试信息的大小。将类型定义放入单独的 .debug_types 节(通常是comdat节)可以让链接器更容易地识别和删除重复的类型定义。
然而,使用 -fdebug-types-section 选项也存在一些限制和问题:
DWARF 消费者的兼容性:并非所有处理 DWARF 调试信息的工具(如调试器和分析器)都支持 .debug_types 节。在这种情况下,使用 -fdebug-types-section 可能会导致兼容性问题。
调试信息大小:在某些情况下,使用 .debug_types 节可能会导致生成的调试信息更大,而不是更小。这取决于具体的对象文件和类型定义。
总之,-fdebug-types-section 选项用于将类型定义放入单独的 .debug_types 节,以提高链接器效率。然而,在使用此选项时,请注意兼容性和调试信息大小的潜在问题。在选择是否使用此选项时,请根据您的项目需求和目标平台进行权衡。
–compress-debug-sections=zlib
--compress-debug-sections=none
--compress-debug-sections=zlib
--compress-debug-sections=zlib-gnu
--compress-debug-sections=zlib-gabi
--compress-debug-sections=zstd
On ELF platforms, these options control how DWARF debug sections are compressed using zlib.
使用 -Wl,–compress-debug-sections=zlib 可以压缩调试信息,从而减小生成的二进制文件大小。然而,在使用此选项时,有一些注意事项和可能的问题:
调试器兼容性:并非所有调试器都支持压缩后的调试信息。在使用压缩调试信息的二进制文件进行调试时,请确保您的调试器(如GDB)支持处理压缩后的调试节。较新版本的GDB通常支持这一点。
解压缩开销:虽然压缩调试信息可以减小文件大小,但在调试过程中,调试器需要解压缩这些信息。这可能会导致调试过程稍微变慢。对于大型项目,解压缩时间可能会有所增加。
链接器支持:并非所有链接器都支持 –compress-debug-sections 选项。在使用此选项时,请确保您的链接器支持它。通常,较新版本的GNU ld链接器支持此功能。
二进制文件可移植性:如果您需要将二进制文件分发给其他用户,他们可能使用不同的调试器或操作系统。在这种情况下,使用压缩调试信息可能会导致兼容性问题。在将二进制文件分发给其他用户之前,请确保他们的环境支持处理压缩后的调试信息。
总之,在使用 -Wl,–compress-debug-sections=zlib 选项时,请确保您的工具链和调试器支持处理压缩后的调试信息。同时,请注意,在某些情况下,这可能会影响调试过程的性能。
通过 readelf -S 可以查看 .debug_info 在使用压缩后的大小变化:
$ls -lh unittestsvr*
-rwxr-xr-x 1 gerryyang users 224M 7月  22 12:04 unittestsvr.nozip
-rwxr-xr-x 1 gerryyang users 106M 7月  22 12:04 unittestsvr.zip
$readelf -S unittestsvr.nozip | grep -A1 .debug_info
  [34] .debug_info       PROGBITS         0000000000000000  02b55390
       000000000442cdcd  0000000000000000           0     0     1
$readelf -S unittestsvr.zip | grep -A1 .debug_info
  [34] .debug_info       PROGBITS         0000000000000000  0396840d
       0000000001e87e1a  0000000000000000   C       0     0     1
截至目前(2022年2月),Clang编译器和GNU ld链接器尚未支持 –compress-debug-sections=zstd 选项。目前,GNU ld链接器支持的调试信息压缩方法是zlib(–compress-debug-sections=zlib)。
如果您希望使用 zstd 压缩调试信息,可以考虑在编译和链接完成后手动压缩调试信息。以下是一个使用 objcopy 工具手动压缩调试信息的示例:
首先,使用-g选项编译源代码以生成调试信息:
clang -g -o output_file input_file.c
使用objcopy将未压缩的调试信息从二进制文件中提取到单独的文件:
objcopy --only-keep-debug output_file output_file.debug
使用zstd手动压缩提取的调试信息:
zstd -o output_file.debug.zst output_file.debug
将压缩后的调试信息与二进制文件关联:
objcopy --add-gnu-debuglink=output_file.debug.zst output_file
请注意,这种方法可能不被所有调试器支持,因为它们可能无法识别zstd压缩的调试信息。在使用此方法之前,请确保您的调试器支持处理zstd压缩的调试信息。
其他
-fno-rtti / -frtti
- https://desk.zoho.com.cn/portal/sylixos/zh/kb/articles/c-%E7%BC%96%E8%AF%91%E9%80%89%E9%A1%B9-fno-rtti-%E5%92%8C-frtti%E6%B5%85%E6%9E%90
- https://stackoverflow.com/questions/23912955/disable-rtti-for-some-classes
- https://stackoverflow.com/questions/36261573/gcc-c-override-frtti-for-single-class
-Wl,–start-group / -Wl,–end-group
What are the –start-group and –end-group command line options?
What is the purpose of those command line options? Please help to decipher the meaning of the following command line:
-Wl,--start-group -lmy_lib -lyour_lib -lhis_lib -Wl,--end-group -ltheir_lib
Apparently it has something to do with linking, but the GNU manual is quiet what exactly grouping means.
Answers:
It is for resolving circular dependences between several libraries (listed between -( and -)).
Citing Why does the order in which libraries are linked sometimes cause errors in GCC? or man ld http://linux.die.net/man/1/ld
-(archives-)or--start-grouparchives--end-groupThe archives should be a list of archive files. They may be either explicit file names, or -l options.
The specified archives are searched repeatedly until no new undefined references are created. Normally, an archive is searched only once in the order that it is specified on the command line. If a symbol in that archive is needed to resolve an undefined symbol referred to by an object in an archive that appears later on the command line, the linker would not be able to resolve that reference. By grouping the archives, they all be searched repeatedly until all possible references are resolved.
Using this option has a significant performance cost. It is best to use it only when there are unavoidable circular references between two or more archives.
So, libraries inside the group can be searched for new symbols several time, and you need no ugly constructs like -llib1 -llib2 -llib1
PS archive means basically a static library (*.a files)
编译优化过程调试
Investigating compile times, and Clang -ftime-report
Need for build time investigation tools
Depending on how your large your codebase is, and how it is structured, C++ compilation times may or might not be an issue for you. It certainly is for us at Unity, and my understanding of build times of other large projects (like Chrome, LLVM or UE4), they aren’t exactly “fast” either. There are various underlying reasons for why C++ codebases might be slow to compile (preprocessor, complexity of the language, template instantiations, optimizations done by the compiler, linking times etc.).
It would make sense to have some tools that a programmer could use to help them understand where or why their code is slow to compile.
You might think that, given how big of an issue compile times are in C++, there would be readily-available tools to do that. E.g. some flags in the popular compilers, or something?
The reality, at least right now, is “ehhh, not really”. There really are no good tools in C++ compilers to help you with investigating build times.
Build timing tools in existing compilers
I’ll do example with a super small C++ snippet that just includes some STL headers and does something with them. See the snippet and the output from three major compilers (Visual Studio, Gcc, Clang) in Compiler Explorer here. The actual code does not do anything useful, I just needed something to throw at the compiler.
#include <vector>
#include <string>
#include <unordered_map>
#include <regex>

int main()
{
    std::vector<int> v(10);
    v.push_back(7);
    std::unordered_map<std::string, double> m;
    m.insert(std::make_pair("foo", 1.0));
    std::regex re("^asd.*$");
    return 0;
}
I’m testing with Visual Studio 2017 v15.9, Gcc 8.2 and Clang 7.0.
Gcc
I’m not using Gcc much, and at least in my industry (game development), it’s not very popular. Out of all platforms that I happen to use at work, they are all on either Visual Studio or some variant of Clang. Gcc is only used on Linux, and even there, there’s an option to use Clang.
Anyway, gcc has -ftime-report argument that prints information about where time was spent during compilation. Brace yourself, this will be over 100 lines of text:
#!/bin/bash

g++ -std=c++11 -o test -O2 -ftime-report test.cc
Time variable usr sys wall GGC
phase setup : 0.00 ( 0%) 0.00 ( 0%) 0.01 ( 0%) 1379 kB ( 1%)
phase parsing : 0.84 ( 25%) 0.46 ( 48%) 1.31 ( 27%) 78498 kB ( 40%)
phase lang. deferred : 0.34 ( 10%) 0.12 ( 13%) 0.45 ( 9%) 35437 kB ( 18%)
phase opt and generate : 2.15 ( 65%) 0.37 ( 39%) 3.03 ( 63%) 82904 kB ( 42%)
|name lookup : 0.29 ( 9%) 0.10 ( 11%) 0.32 ( 7%) 4370 kB ( 2%)
|overload resolution : 0.22 ( 7%) 0.05 ( 5%) 0.28 ( 6%) 19307 kB ( 10%)
dump files : 0.11 ( 3%) 0.03 ( 3%) 0.12 ( 3%) 0 kB ( 0%)
callgraph construction : 0.07 ( 2%) 0.00 ( 0%) 0.04 ( 1%) 3771 kB ( 2%)
callgraph optimization : 0.07 ( 2%) 0.02 ( 2%) 0.13 ( 3%) 87 kB ( 0%)
ipa dead code removal : 0.00 ( 0%) 0.00 ( 0%) 0.01 ( 0%) 0 kB ( 0%)
ipa cp : 0.00 ( 0%) 0.00 ( 0%) 0.01 ( 0%) 563 kB ( 0%)
ipa inlining heuristics : 0.01 ( 0%) 0.00 ( 0%) 0.02 ( 0%) 650 kB ( 0%)
ipa function splitting : 0.00 ( 0%) 0.01 ( 1%) 0.02 ( 0%) 182 kB ( 0%)
ipa pure const : 0.00 ( 0%) 0.00 ( 0%) 0.02 ( 0%) 22 kB ( 0%)
ipa icf : 0.01 ( 0%) 0.00 ( 0%) 0.02 ( 0%) 0 kB ( 0%)
ipa SRA : 0.07 ( 2%) 0.01 ( 1%) 0.03 ( 1%) 5076 kB ( 3%)
cfg construction : 0.01 ( 0%) 0.00 ( 0%) 0.00 ( 0%) 181 kB ( 0%)
cfg cleanup : 0.06 ( 2%) 0.00 ( 0%) 0.00 ( 0%) 202 kB ( 0%)
trivially dead code : 0.01 ( 0%) 0.01 ( 1%) 0.01 ( 0%) 0 kB ( 0%)
df scan insns : 0.01 ( 0%) 0.01 ( 1%) 0.01 ( 0%) 7 kB ( 0%)
df multiple defs : 0.01 ( 0%) 0.00 ( 0%) 0.00 ( 0%) 0 kB ( 0%)
df reaching defs : 0.00 ( 0%) 0.01 ( 1%) 0.04 ( 1%) 0 kB ( 0%)
df live regs : 0.04 ( 1%) 0.00 ( 0%) 0.02 ( 0%) 0 kB ( 0%)
df live&initialized regs : 0.04 ( 1%) 0.00 ( 0%) 0.07 ( 1%) 0 kB ( 0%)
df use-def / def-use chains : 0.01 ( 0%) 0.00 ( 0%) 0.00 ( 0%) 0 kB ( 0%)
df reg dead/unused notes : 0.05 ( 2%) 0.00 ( 0%) 0.02 ( 0%) 498 kB ( 0%)
alias analysis : 0.01 ( 0%) 0.00 ( 0%) 0.02 ( 0%) 1183 kB ( 1%)
alias stmt walking : 0.05 ( 2%) 0.00 ( 0%) 0.06 ( 1%) 85 kB ( 0%)
rebuild jump labels : 0.01 ( 0%) 0.00 ( 0%) 0.00 ( 0%) 0 kB ( 0%)
preprocessing : 0.12 ( 4%) 0.13 ( 14%) 0.28 ( 6%) 2539 kB ( 1%)
parser (global) : 0.20 ( 6%) 0.11 ( 12%) 0.27 ( 6%) 26043 kB ( 13%)
parser struct body : 0.09 ( 3%) 0.02 ( 2%) 0.13 ( 3%) 13861 kB ( 7%)
parser function body : 0.07 ( 2%) 0.01 ( 1%) 0.09 ( 2%) 4688 kB ( 2%)
parser inl. func. body : 0.01 ( 0%) 0.01 ( 1%) 0.06 ( 1%) 1596 kB ( 1%)
parser inl. meth. body : 0.14 ( 4%) 0.07 ( 7%) 0.16 ( 3%) 8242 kB ( 4%)
template instantiation : 0.51 ( 15%) 0.21 ( 22%) 0.75 ( 16%) 56689 kB ( 29%)
constant expression evaluation : 0.03 ( 1%) 0.02 ( 2%) 0.02 ( 0%) 180 kB ( 0%)
early inlining heuristics : 0.01 ( 0%) 0.00 ( 0%) 0.02 ( 0%) 1572 kB ( 1%)
inline parameters : 0.00 ( 0%) 0.02 ( 2%) 0.06 ( 1%) 4040 kB ( 2%)
integration : 0.07 ( 2%) 0.01 ( 1%) 0.04 ( 1%) 10635 kB ( 5%)
tree gimplify : 0.01 ( 0%) 0.02 ( 2%) 0.04 ( 1%) 6651 kB ( 3%)
tree eh : 0.01 ( 0%) 0.00 ( 0%) 0.01 ( 0%) 1036 kB ( 1%)
tree CFG construction : 0.00 ( 0%) 0.00 ( 0%) 0.02 ( 0%) 2796 kB ( 1%)
tree CFG cleanup : 0.05 ( 2%) 0.01 ( 1%) 0.11 ( 2%) 66 kB ( 0%)
tree tail merge : 0.00 ( 0%) 0.00 ( 0%) 0.01 ( 0%) 170 kB ( 0%)
tree VRP : 0.05 ( 2%) 0.00 ( 0%) 0.07 ( 1%) 1596 kB ( 1%)
tree Early VRP : 0.06 ( 2%) 0.01 ( 1%) 0.08 ( 2%) 2079 kB ( 1%)
tree copy propagation : 0.00 ( 0%) 0.01 ( 1%) 0.00 ( 0%) 9 kB ( 0%)
tree PTA : 0.05 ( 2%) 0.01 ( 1%) 0.06 ( 1%) 641 kB ( 0%)
tree PHI insertion : 0.00 ( 0%) 0.01 ( 1%) 0.00 ( 0%) 257 kB ( 0%)
tree SSA rewrite : 0.02 ( 1%) 0.01 ( 1%) 0.02 ( 0%) 2006 kB ( 1%)
tree SSA other : 0.02 ( 1%) 0.01 ( 1%) 0.02 ( 0%) 272 kB ( 0%)
tree SSA incremental : 0.01 ( 0%) 0.01 ( 1%) 0.03 ( 1%) 381 kB ( 0%)
tree operand scan : 0.05 ( 2%) 0.00 ( 0%) 0.14 ( 3%) 6173 kB ( 3%)
dominator optimization : 0.05 ( 2%) 0.01 ( 1%) 0.09 ( 2%) 1298 kB ( 1%)
backwards jump threading : 0.00 ( 0%) 0.00 ( 0%) 0.02 ( 0%) 142 kB ( 0%)
tree SRA : 0.00 ( 0%) 0.02 ( 2%) 0.02 ( 0%) 377 kB ( 0%)
tree CCP : 0.02 ( 1%) 0.00 ( 0%) 0.18 ( 4%) 323 kB ( 0%)
tree PRE : 0.02 ( 1%) 0.03 ( 3%) 0.06 ( 1%) 1024 kB ( 1%)
tree FRE : 0.05 ( 2%) 0.01 ( 1%) 0.05 ( 1%) 677 kB ( 0%)
tree linearize phis : 0.00 ( 0%) 0.00 ( 0%) 0.02 ( 0%) 175 kB ( 0%)
tree forward propagate : 0.02 ( 1%) 0.00 ( 0%) 0.07 ( 1%) 270 kB ( 0%)
tree conservative DCE : 0.01 ( 0%) 0.00 ( 0%) 0.03 ( 1%) 40 kB ( 0%)
tree aggressive DCE : 0.03 ( 1%) 0.01 ( 1%) 0.03 ( 1%) 2144 kB ( 1%)
tree DSE : 0.00 ( 0%) 0.00 ( 0%) 0.02 ( 0%) 31 kB ( 0%)
tree loop invariant motion : 0.01 ( 0%) 0.00 ( 0%) 0.00 ( 0%) 0 kB ( 0%)
tree iv optimization : 0.01 ( 0%) 0.00 ( 0%) 0.00 ( 0%) 682 kB ( 0%)
dominance frontiers : 0.01 ( 0%) 0.00 ( 0%) 0.00 ( 0%) 0 kB ( 0%)
dominance computation : 0.07 ( 2%) 0.01 ( 1%) 0.08 ( 2%) 0 kB ( 0%)
control dependences : 0.00 ( 0%) 0.00 ( 0%) 0.01 ( 0%) 0 kB ( 0%)
out of ssa : 0.01 ( 0%) 0.00 ( 0%) 0.03 ( 1%) 14 kB ( 0%)
expand vars : 0.00 ( 0%) 0.00 ( 0%) 0.01 ( 0%) 307 kB ( 0%)
expand : 0.04 ( 1%) 0.01 ( 1%) 0.04 ( 1%) 3841 kB ( 2%)
post expand cleanups : 0.00 ( 0%) 0.01 ( 1%) 0.01 ( 0%) 292 kB ( 0%)
varconst : 0.01 ( 0%) 0.00 ( 0%) 0.00 ( 0%) 5 kB ( 0%)
CSE : 0.05 ( 2%) 0.00 ( 0%) 0.05 ( 1%) 135 kB ( 0%)
dead code elimination : 0.01 ( 0%) 0.00 ( 0%) 0.01 ( 0%) 0 kB ( 0%)
dead store elim1 : 0.02 ( 1%) 0.00 ( 0%) 0.02 ( 0%) 397 kB ( 0%)
dead store elim2 : 0.01 ( 0%) 0.00 ( 0%) 0.03 ( 1%) 617 kB ( 0%)
loop analysis : 0.01 ( 0%) 0.00 ( 0%) 0.00 ( 0%) 0 kB ( 0%)
loop init : 0.05 ( 2%) 0.00 ( 0%) 0.04 ( 1%) 2543 kB ( 1%)
loop invariant motion : 0.00 ( 0%) 0.00 ( 0%) 0.01 ( 0%) 3 kB ( 0%)
loop fini : 0.01 ( 0%) 0.00 ( 0%) 0.00 ( 0%) 0 kB ( 0%)
CPROP : 0.04 ( 1%) 0.01 ( 1%) 0.02 ( 0%) 611 kB ( 0%)
PRE : 0.01 ( 0%) 0.00 ( 0%) 0.00 ( 0%) 87 kB ( 0%)
CSE 2 : 0.01 ( 0%) 0.00 ( 0%) 0.02 ( 0%) 80 kB ( 0%)
branch prediction : 0.02 ( 1%) 0.00 ( 0%) 0.01 ( 0%) 412 kB ( 0%)
combiner : 0.05 ( 2%) 0.00 ( 0%) 0.07 ( 1%) 930 kB ( 0%)
if-conversion : 0.01 ( 0%) 0.00 ( 0%) 0.02 ( 0%) 73 kB ( 0%)
integrated RA : 0.05 ( 2%) 0.00 ( 0%) 0.07 ( 1%) 5783 kB ( 3%)
LRA non-specific : 0.03 ( 1%) 0.00 ( 0%) 0.03 ( 1%) 297 kB ( 0%)
LRA virtuals elimination : 0.01 ( 0%) 0.00 ( 0%) 0.01 ( 0%) 206 kB ( 0%)
LRA create live ranges : 0.01 ( 0%) 0.00 ( 0%) 0.01 ( 0%) 42 kB ( 0%)
LRA rematerialization : 0.01 ( 0%) 0.00 ( 0%) 0.01 ( 0%) 0 kB ( 0%)
reload CSE regs : 0.03 ( 1%) 0.00 ( 0%) 0.04 ( 1%) 565 kB ( 0%)
ree : 0.00 ( 0%) 0.00 ( 0%) 0.03 ( 1%) 7 kB ( 0%)
thread pro- & epilogue : 0.01 ( 0%) 0.00 ( 0%) 0.01 ( 0%) 449 kB ( 0%)
peephole 2 : 0.01 ( 0%) 0.00 ( 0%) 0.02 ( 0%) 40 kB ( 0%)
hard reg cprop : 0.01 ( 0%) 0.00 ( 0%) 0.01 ( 0%) 7 kB ( 0%)
scheduling 2 : 0.07 ( 2%) 0.00 ( 0%) 0.14 ( 3%) 324 kB ( 0%)
machine dep reorg : 0.00 ( 0%) 0.00 ( 0%) 0.01 ( 0%) 0 kB ( 0%)
reorder blocks : 0.02 ( 1%) 0.00 ( 0%) 0.01 ( 0%) 295 kB ( 0%)
shorten branches : 0.00 ( 0%) 0.00 ( 0%) 0.01 ( 0%) 0 kB ( 0%)
final : 0.02 ( 1%) 0.01 ( 1%) 0.01 ( 0%) 1113 kB ( 1%)
rest of compilation : 0.11 ( 3%) 0.00 ( 0%) 0.09 ( 2%) 721 kB ( 0%)
unaccounted post reload : 0.00 ( 0%) 0.00 ( 0%) 0.01 ( 0%) 0 kB ( 0%)
remove unused locals : 0.02 ( 1%) 0.00 ( 0%) 0.03 ( 1%) 2 kB ( 0%)
address taken : 0.02 ( 1%) 0.01 ( 1%) 0.01 ( 0%) 0 kB ( 0%)
repair loop structures : 0.01 ( 0%) 0.00 ( 0%) 0.00 ( 0%) 2 kB ( 0%)
TOTAL : 3.33 0.95 4.80 Time variable usr sys wall GGC
phase setup : 0.00 ( 0%) 0.00 ( 0%) 0.01 ( 0%) 1379 kB ( 1%)
phase parsing : 0.84 ( 25%) 0.46 ( 48%) 1.31 ( 27%) 78498 kB ( 40%)
phase lang. deferred : 0.34 ( 10%) 0.12 ( 13%) 0.45 ( 9%) 35437 kB ( 18%)
phase opt and generate : 2.15 ( 65%) 0.37 ( 39%) 3.03 ( 63%) 82904 kB ( 42%)
|name lookup : 0.29 ( 9%) 0.10 ( 11%) 0.32 ( 7%) 4370 kB ( 2%)
|overload resolution : 0.22 ( 7%) 0.05 ( 5%) 0.28 ( 6%) 19307 kB ( 10%)
dump files : 0.11 ( 3%) 0.03 ( 3%) 0.12 ( 3%) 0 kB ( 0%)
callgraph construction : 0.07 ( 2%) 0.00 ( 0%) 0.04 ( 1%) 3771 kB ( 2%)
callgraph optimization : 0.07 ( 2%) 0.02 ( 2%) 0.13 ( 3%) 87 kB ( 0%)
ipa dead code removal : 0.00 ( 0%) 0.00 ( 0%) 0.01 ( 0%) 0 kB ( 0%)
ipa cp : 0.00 ( 0%) 0.00 ( 0%) 0.01 ( 0%) 563 kB ( 0%)
ipa inlining heuristics : 0.01 ( 0%) 0.00 ( 0%) 0.02 ( 0%) 650 kB ( 0%)
ipa function splitting : 0.00 ( 0%) 0.01 ( 1%) 0.02 ( 0%) 182 kB ( 0%)
ipa pure const : 0.00 ( 0%) 0.00 ( 0%) 0.02 ( 0%) 22 kB ( 0%)
ipa icf : 0.01 ( 0%) 0.00 ( 0%) 0.02 ( 0%) 0 kB ( 0%)
ipa SRA : 0.07 ( 2%) 0.01 ( 1%) 0.03 ( 1%) 5076 kB ( 3%)
cfg construction : 0.01 ( 0%) 0.00 ( 0%) 0.00 ( 0%) 181 kB ( 0%)
cfg cleanup : 0.06 ( 2%) 0.00 ( 0%) 0.00 ( 0%) 202 kB ( 0%)
trivially dead code : 0.01 ( 0%) 0.01 ( 1%) 0.01 ( 0%) 0 kB ( 0%)
df scan insns : 0.01 ( 0%) 0.01 ( 1%) 0.01 ( 0%) 7 kB ( 0%)
df multiple defs : 0.01 ( 0%) 0.00 ( 0%) 0.00 ( 0%) 0 kB ( 0%)
df reaching defs : 0.00 ( 0%) 0.01 ( 1%) 0.04 ( 1%) 0 kB ( 0%)
df live regs : 0.04 ( 1%) 0.00 ( 0%) 0.02 ( 0%) 0 kB ( 0%)
df live&initialized regs : 0.04 ( 1%) 0.00 ( 0%) 0.07 ( 1%) 0 kB ( 0%)
df use-def / def-use chains : 0.01 ( 0%) 0.00 ( 0%) 0.00 ( 0%) 0 kB ( 0%)
df reg dead/unused notes : 0.05 ( 2%) 0.00 ( 0%) 0.02 ( 0%) 498 kB ( 0%)
alias analysis : 0.01 ( 0%) 0.00 ( 0%) 0.02 ( 0%) 1183 kB ( 1%)
alias stmt walking : 0.05 ( 2%) 0.00 ( 0%) 0.06 ( 1%) 85 kB ( 0%)
rebuild jump labels : 0.01 ( 0%) 0.00 ( 0%) 0.00 ( 0%) 0 kB ( 0%)
preprocessing : 0.12 ( 4%) 0.13 ( 14%) 0.28 ( 6%) 2539 kB ( 1%)
parser (global) : 0.20 ( 6%) 0.11 ( 12%) 0.27 ( 6%) 26043 kB ( 13%)
parser struct body : 0.09 ( 3%) 0.02 ( 2%) 0.13 ( 3%) 13861 kB ( 7%)
parser function body : 0.07 ( 2%) 0.01 ( 1%) 0.09 ( 2%) 4688 kB ( 2%)
parser inl. func. body : 0.01 ( 0%) 0.01 ( 1%) 0.06 ( 1%) 1596 kB ( 1%)
parser inl. meth. body : 0.14 ( 4%) 0.07 ( 7%) 0.16 ( 3%) 8242 kB ( 4%)
template instantiation : 0.51 ( 15%) 0.21 ( 22%) 0.75 ( 16%) 56689 kB ( 29%)
constant expression evaluation : 0.03 ( 1%) 0.02 ( 2%) 0.02 ( 0%) 180 kB ( 0%)
early inlining heuristics : 0.01 ( 0%) 0.00 ( 0%) 0.02 ( 0%) 1572 kB ( 1%)
inline parameters : 0.00 ( 0%) 0.02 ( 2%) 0.06 ( 1%) 4040 kB ( 2%)
integration : 0.07 ( 2%) 0.01 ( 1%) 0.04 ( 1%) 10635 kB ( 5%)
tree gimplify : 0.01 ( 0%) 0.02 ( 2%) 0.04 ( 1%) 6651 kB ( 3%)
tree eh : 0.01 ( 0%) 0.00 ( 0%) 0.01 ( 0%) 1036 kB ( 1%)
tree CFG construction : 0.00 ( 0%) 0.00 ( 0%) 0.02 ( 0%) 2796 kB ( 1%)
tree CFG cleanup : 0.05 ( 2%) 0.01 ( 1%) 0.11 ( 2%) 66 kB ( 0%)
tree tail merge : 0.00 ( 0%) 0.00 ( 0%) 0.01 ( 0%) 170 kB ( 0%)
tree VRP : 0.05 ( 2%) 0.00 ( 0%) 0.07 ( 1%) 1596 kB ( 1%)
tree Early VRP : 0.06 ( 2%) 0.01 ( 1%) 0.08 ( 2%) 2079 kB ( 1%)
tree copy propagation : 0.00 ( 0%) 0.01 ( 1%) 0.00 ( 0%) 9 kB ( 0%)
tree PTA : 0.05 ( 2%) 0.01 ( 1%) 0.06 ( 1%) 641 kB ( 0%)
tree PHI insertion : 0.00 ( 0%) 0.01 ( 1%) 0.00 ( 0%) 257 kB ( 0%)
tree SSA rewrite : 0.02 ( 1%) 0.01 ( 1%) 0.02 ( 0%) 2006 kB ( 1%)
tree SSA other : 0.02 ( 1%) 0.01 ( 1%) 0.02 ( 0%) 272 kB ( 0%)
tree SSA incremental : 0.01 ( 0%) 0.01 ( 1%) 0.03 ( 1%) 381 kB ( 0%)
tree operand scan : 0.05 ( 2%) 0.00 ( 0%) 0.14 ( 3%) 6173 kB ( 3%)
dominator optimization : 0.05 ( 2%) 0.01 ( 1%) 0.09 ( 2%) 1298 kB ( 1%)
backwards jump threading : 0.00 ( 0%) 0.00 ( 0%) 0.02 ( 0%) 142 kB ( 0%)
tree SRA : 0.00 ( 0%) 0.02 ( 2%) 0.02 ( 0%) 377 kB ( 0%)
tree CCP : 0.02 ( 1%) 0.00 ( 0%) 0.18 ( 4%) 323 kB ( 0%)
tree PRE : 0.02 ( 1%) 0.03 ( 3%) 0.06 ( 1%) 1024 kB ( 1%)
tree FRE : 0.05 ( 2%) 0.01 ( 1%) 0.05 ( 1%) 677 kB ( 0%)
tree linearize phis : 0.00 ( 0%) 0.00 ( 0%) 0.02 ( 0%) 175 kB ( 0%)
tree forward propagate : 0.02 ( 1%) 0.00 ( 0%) 0.07 ( 1%) 270 kB ( 0%)
tree conservative DCE : 0.01 ( 0%) 0.00 ( 0%) 0.03 ( 1%) 40 kB ( 0%)
tree aggressive DCE : 0.03 ( 1%) 0.01 ( 1%) 0.03 ( 1%) 2144 kB ( 1%)
tree DSE : 0.00 ( 0%) 0.00 ( 0%) 0.02 ( 0%) 31 kB ( 0%)
tree loop invariant motion : 0.01 ( 0%) 0.00 ( 0%) 0.00 ( 0%) 0 kB ( 0%)
tree iv optimization : 0.01 ( 0%) 0.00 ( 0%) 0.00 ( 0%) 682 kB ( 0%)
dominance frontiers : 0.01 ( 0%) 0.00 ( 0%) 0.00 ( 0%) 0 kB ( 0%)
dominance computation : 0.07 ( 2%) 0.01 ( 1%) 0.08 ( 2%) 0 kB ( 0%)
control dependences : 0.00 ( 0%) 0.00 ( 0%) 0.01 ( 0%) 0 kB ( 0%)
out of ssa : 0.01 ( 0%) 0.00 ( 0%) 0.03 ( 1%) 14 kB ( 0%)
expand vars : 0.00 ( 0%) 0.00 ( 0%) 0.01 ( 0%) 307 kB ( 0%)
expand : 0.04 ( 1%) 0.01 ( 1%) 0.04 ( 1%) 3841 kB ( 2%)
post expand cleanups : 0.00 ( 0%) 0.01 ( 1%) 0.01 ( 0%) 292 kB ( 0%)
varconst : 0.01 ( 0%) 0.00 ( 0%) 0.00 ( 0%) 5 kB ( 0%)
CSE : 0.05 ( 2%) 0.00 ( 0%) 0.05 ( 1%) 135 kB ( 0%)
dead code elimination : 0.01 ( 0%) 0.00 ( 0%) 0.01 ( 0%) 0 kB ( 0%)
dead store elim1 : 0.02 ( 1%) 0.00 ( 0%) 0.02 ( 0%) 397 kB ( 0%)
dead store elim2 : 0.01 ( 0%) 0.00 ( 0%) 0.03 ( 1%) 617 kB ( 0%)
loop analysis : 0.01 ( 0%) 0.00 ( 0%) 0.00 ( 0%) 0 kB ( 0%)
loop init : 0.05 ( 2%) 0.00 ( 0%) 0.04 ( 1%) 2543 kB ( 1%)
loop invariant motion : 0.00 ( 0%) 0.00 ( 0%) 0.01 ( 0%) 3 kB ( 0%)
loop fini : 0.01 ( 0%) 0.00 ( 0%) 0.00 ( 0%) 0 kB ( 0%)
CPROP : 0.04 ( 1%) 0.01 ( 1%) 0.02 ( 0%) 611 kB ( 0%)
PRE : 0.01 ( 0%) 0.00 ( 0%) 0.00 ( 0%) 87 kB ( 0%)
CSE 2 : 0.01 ( 0%) 0.00 ( 0%) 0.02 ( 0%) 80 kB ( 0%)
branch prediction : 0.02 ( 1%) 0.00 ( 0%) 0.01 ( 0%) 412 kB ( 0%)
combiner : 0.05 ( 2%) 0.00 ( 0%) 0.07 ( 1%) 930 kB ( 0%)
if-conversion : 0.01 ( 0%) 0.00 ( 0%) 0.02 ( 0%) 73 kB ( 0%)
integrated RA : 0.05 ( 2%) 0.00 ( 0%) 0.07 ( 1%) 5783 kB ( 3%)
LRA non-specific : 0.03 ( 1%) 0.00 ( 0%) 0.03 ( 1%) 297 kB ( 0%)
LRA virtuals elimination : 0.01 ( 0%) 0.00 ( 0%) 0.01 ( 0%) 206 kB ( 0%)
LRA create live ranges : 0.01 ( 0%) 0.00 ( 0%) 0.01 ( 0%) 42 kB ( 0%)
LRA rematerialization : 0.01 ( 0%) 0.00 ( 0%) 0.01 ( 0%) 0 kB ( 0%)
reload CSE regs : 0.03 ( 1%) 0.00 ( 0%) 0.04 ( 1%) 565 kB ( 0%)
ree : 0.00 ( 0%) 0.00 ( 0%) 0.03 ( 1%) 7 kB ( 0%)
thread pro- & epilogue : 0.01 ( 0%) 0.00 ( 0%) 0.01 ( 0%) 449 kB ( 0%)
peephole 2 : 0.01 ( 0%) 0.00 ( 0%) 0.02 ( 0%) 40 kB ( 0%)
hard reg cprop : 0.01 ( 0%) 0.00 ( 0%) 0.01 ( 0%) 7 kB ( 0%)
scheduling 2 : 0.07 ( 2%) 0.00 ( 0%) 0.14 ( 3%) 324 kB ( 0%)
machine dep reorg : 0.00 ( 0%) 0.00 ( 0%) 0.01 ( 0%) 0 kB ( 0%)
reorder blocks : 0.02 ( 1%) 0.00 ( 0%) 0.01 ( 0%) 295 kB ( 0%)
shorten branches : 0.00 ( 0%) 0.00 ( 0%) 0.01 ( 0%) 0 kB ( 0%)
final : 0.02 ( 1%) 0.01 ( 1%) 0.01 ( 0%) 1113 kB ( 1%)
rest of compilation : 0.11 ( 3%) 0.00 ( 0%) 0.09 ( 2%) 721 kB ( 0%)
unaccounted post reload : 0.00 ( 0%) 0.00 ( 0%) 0.01 ( 0%) 0 kB ( 0%)
remove unused locals : 0.02 ( 1%) 0.00 ( 0%) 0.03 ( 1%) 2 kB ( 0%)
address taken : 0.02 ( 1%) 0.01 ( 1%) 0.01 ( 0%) 0 kB ( 0%)
repair loop structures : 0.01 ( 0%) 0.00 ( 0%) 0.00 ( 0%) 2 kB ( 0%)
TOTAL : 3.33 0.95 4.80 198228 kB
Ok, I guess that totally makes sense, if you are a compiler developer working on gcc itself. But I’m not! Most of the above either does not mean anything to me, or I don’t really care about it.
-
I don’t care that much about “user” or “system” time; I care about how much time I had to wait for compilation to finish (“wall time”). Why it is in the middle of each row?
-
Is this output sorted by something? It’s not sorted from “most expensive” to “least expensive”. Not sorted alphabetically either. I guess it’s sorted by some internal structure that is not obvious to me.
-
I think the
phase parsingis “generally frontend”, andphase opt and generateis “generally backend”; these are good to know. Then later on there’s a more detailedpreprocessingtotemplate instantiationwhich is frontend in more detail; that’s useful too. The rest? Besides some names that mean some optimization passes, many are cryptic to me, and I’m not sure why I should care about them.tree eh? Eh indeed. -
Memory usage numbers are interesting to compiler developers, and maybe are useful to users that are under memory-constrained situations (like 32 bit systems etc.). Me? I don’t really care.
So, while the gcc -ftime-report prints something, and some of that is very useful (template instantiation time; preprocessing time; time spent performing inlining etc.), it seems to be geared towards compiler developers, and less towards users.
Again - if I’m investigating compile times of my code, the question I have is what can I change in my code to make it compile faster? Ideally some tool should be able to tell me both what takes time, and where in the code it does it.
Clang
Clang, being the most “fresh” of all these compilers, should be the most excellent, right? Right?
Just like gcc, it also has -ftime-report option. That produces 900 lines of output! Instead of pasting it in full here, I’ll just link to it.
Several things to note:
-
Almost half of it is just the same information, duplicated? “Register Allocation”, “Instruction Selection and Scheduling”, “DWARF Emission” and “… Pass execution timing report …” sections are just emitted twice, but curiously enough, the other sections are printed just once. This sounds like a bug to me, and testing out various Clang versions in Compiler Explorer suggests that it started with Clang 7.0.0 and still exists on today’s 8.0.0-trunk. I’ve reported it.
-
Within the “Pass Execution Timing Report” section, there’s a bunch of items that are repeated multiple times too, e.g. “Combine redundant instructions” is listed 8 times; and “Function Alias Analysis Results” is listed 21 times. I’ve no idea if that’s a bug or not; I think I don’t care about them anyway.
-
It suffers from the same “oriented to clang compiler developers, and not clang users” that gcc time report does. I really don’t care about all the LLVM optimization passes you ended up doing; and similarly I don’t care about user vs system times or memory usage.
If it stopped printing all the info I don’t care about, did not duplicate half of it, and stopped printing LLVM passes after top 5 most expensive ones, it would already be way more legible, e.g. like this:
===-------------------------------------------------------------------------===
                         Miscellaneous Ungrouped Timers
===-------------------------------------------------------------------------===
   ---Wall Time---  --- Name ---
   4.1943 ( 93.7%)  Code Generation Time
   0.2808 (  6.3%)  LLVM IR Generation Time
   4.4751 (100.0%)  Total
===-------------------------------------------------------------------------===
                              Register Allocation
===-------------------------------------------------------------------------===
  Total Execution Time: 0.0180 seconds (0.0181 wall clock)
===-------------------------------------------------------------------------===
                      Instruction Selection and Scheduling
===-------------------------------------------------------------------------===
  Total Execution Time: 0.2894 seconds (0.2894 wall clock)
===-------------------------------------------------------------------------===
                                 DWARF Emission
===-------------------------------------------------------------------------===
  Total Execution Time: 0.3599 seconds (0.3450 wall clock)
===-------------------------------------------------------------------------===
                      ... Pass execution timing report ...
===-------------------------------------------------------------------------===
  Total Execution Time: 3.5271 seconds (3.5085 wall clock)
   ---Wall Time---  --- Name ---
   0.4859 ( 13.8%)  X86 Assembly Printer
   0.4388 ( 12.5%)  X86 DAG->DAG Instruction Selection
   0.2633 (  7.5%)  Function Integration/Inlining
   0.1228 (  3.5%)  Global Value Numbering
   0.0695 (  2.0%)  Combine redundant instructions
   3.5085 (100.0%)  Total
===-------------------------------------------------------------------------===
                          Clang front-end time report
===-------------------------------------------------------------------------===
  Total Execution Time: 5.2175 seconds (6.3410 wall clock)
   ---Wall Time---  --- Name ---
   6.3410 (100.0%)  Clang front-end timer
   6.3410 (100.0%)  Total
(also, please, drop the “…” around “Pass execution timing report” name; why it is there?)
And then the various “Total” under the sections are quite a bit confusing. Let’s see:
-
“Clang front-end time report” seems to be time for “everything”, not just the frontend (Clang frontend, LLVM backend, and whatever else it did).
-
I think the “backend” (LLVM) total part is under “Misc Ungrouped Timers, Code Generation Time”. This is probably what is “Pass execution timing” + “Register Allocation” + “Instruction Selection and Scheduling” etc.
-
So probably the actual Clang “frontend” (preprocessor, parsing – i.e. doing the C++ bits of the compilation) I could get by subtracting various LLVM related timer bits from the total time. Ugh. Could you just tell me that time please?
Another thing to note: in all the optimization passes, “X86 Assembly Printer” seems to be the heaviest one? That doesn’t sound right. So I dug in a bit… turns out, once you pass -ftime-report flag, then the whole compilation time is heavily affected. It grows from 1.06s to 1.42s in that super simple STL snippet above, and from 16s to 26s in a much heavier source file I had. Normally for any sort of profiling tool I’d expect at max a couple percent overhead, but Clang’s time report seems to make compilation take 1.5x longer! This sounds like a bug to me, so… reported!
Even if presence of -ftime-report did not distort the compile times so much, Clang’s current implementation leaves much to be desired. It does not even tell me “how much time I spent parsing C++ code”, for example (without me manually doing the math), and does not tell other important aspects like “how much time I spent instantiating templates”. And just like gcc time report, it never tells where in my code the expensive parts actually are.
But surely someone would have solved this already?
I thought so too! But that doesn’t seem to be the case.
For Clang, various people have proposed changes or submitted patches to improve time report in some ways, for example:
-
This patch by Eddie Elizondo adds template instantiation timers. Done in August 2017, everyone in discussion agreed it’s a good idea. Now it’s January 2019…
-
This patch by Brian Gesiak added preprocessor timer in August 2017 too. After some back and forth discussion, eventually abandoned since someone else (Andrew Tischenko) said he’ll implement it in a better way. That was 2018 February.
So I have spent a bit of time trying to make Clang do a “more useful for me” time report. It already pointed out one seemingly simple header file that we had, that was causing Clang to take “ages” (5-8 seconds) just including it, due to some recursive macro usage that Clang isn’t fast to plow through. Yay tools!
What I did and how it works will be in the next blog post! But maybe you can guess on what it might be from my past blog posts (here or here), and from this teaser image:
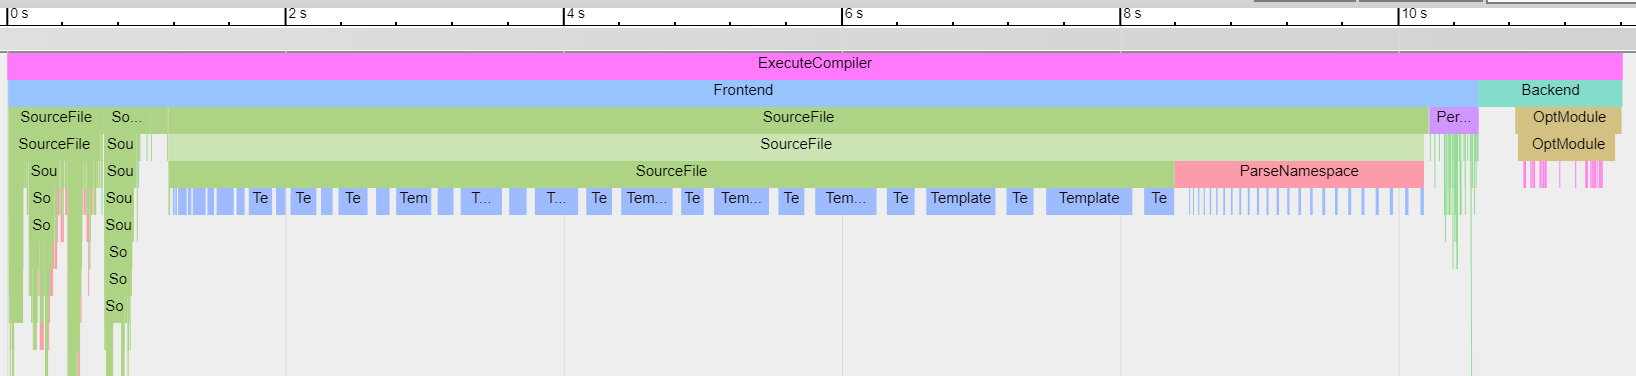
time-trace: timeline / flame chart profiler for Clang
Time trace profiler output support (-ftime-trace) #2
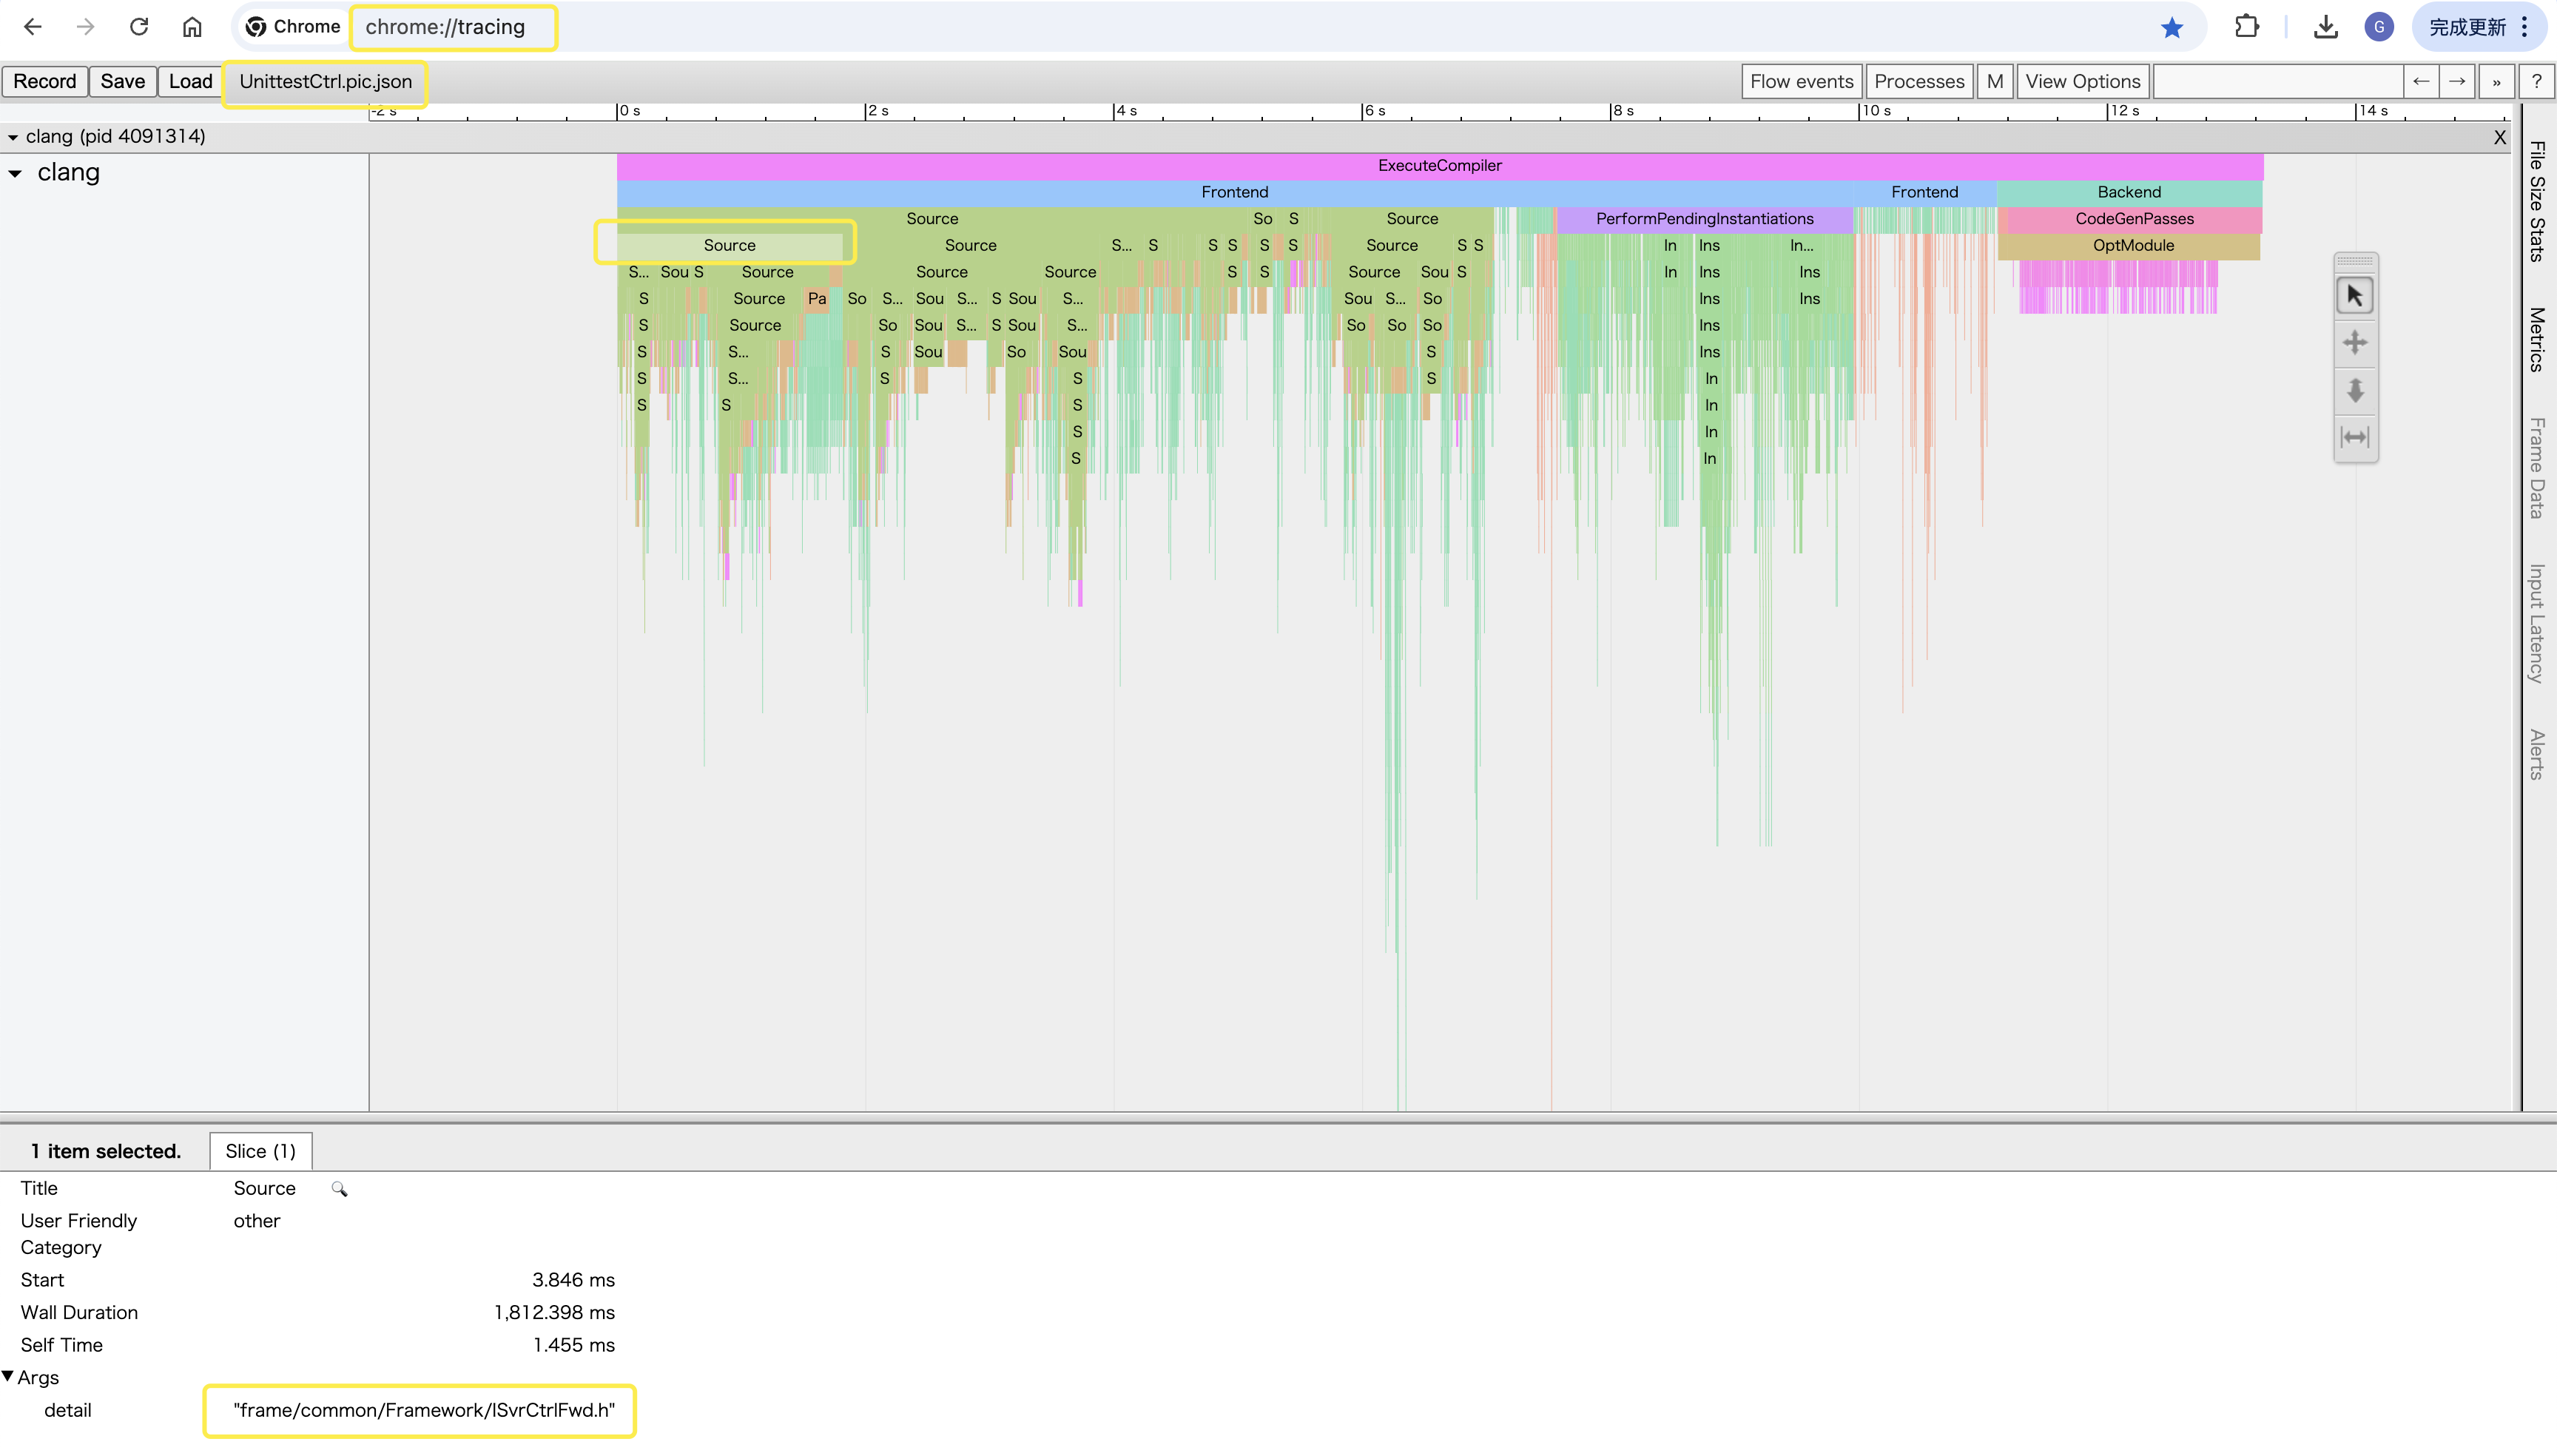
Update: this has landed to LLVM/Clang mainline! So if all goes well, Clang 9.0 should contain this functionality. The upstreaming commit landed on 2019 March 30; thanks Anton Afanasyev for doing the work of landing it!
I wanted Clang to emit timeline (“flame chart”) style profiling info on where it spends time. So I made it do that.
What kind of compiler profiler I want?
In the previous blog post I talked about how it is hard to get “useful” information on where C++ compilers spend their time. Various compilers have various ways of reporting something, but most of their reports seem to be geared towards the compiler developers themselves. For them it’s important to know, for example, whether register allocator is the bottleneck; for me as a compiler user that is much less of an importance – I want to know whether I’m bottlenecked by preprocessor / includes (if so, which ones?), parsing (if so, which classes/functions/templates?), template instantiation (if so, which ones?), code generation, backend optimizations, or something else.
Having added Chrome Tracing profiling outputs to other parts of our build system in the past (here or there), I quite like it. It’s not perfect, and the UI is not very good, but it gets the job done and the file format is trivial to write.
So I thought I’d try doing it – add some sort of flag to Clang that would emit the profiling information that I would find interesting. Turns out, getting to the “it seems to work” state was easier than I expected!
-ftime-trace: Chrome Tracing output for Clang
The very first thing I tried it on pointed out a really useful thing: we have a super slow to include header in one place. Just look:
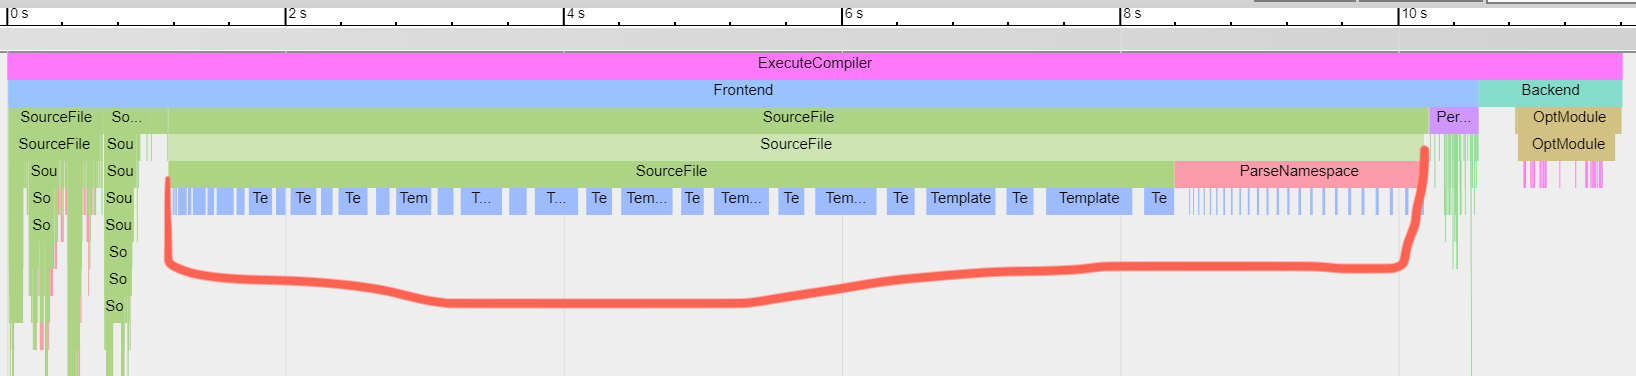
This is a timeline / flame chart profiling view in Chrome chrome://tracing page. Horizontal axis is time, vertical is nested “callstacks”, so to speak. And it very clearly shows that there is one header file that takes over 8 seconds to include.
I suspect it’s some sort of performance issue with Clang itself; Gcc and Msvc are quite a bit faster at including this file. Will try to gather data and report a bug.
So that was already fairly useful. With this visualization, I can look into other files and see what they end up doing. And based on that, decide what to do to make compiles faster. When including/parsing files takes up time, I can tell which ones are the culprit exactly, and how long it takes to include them:
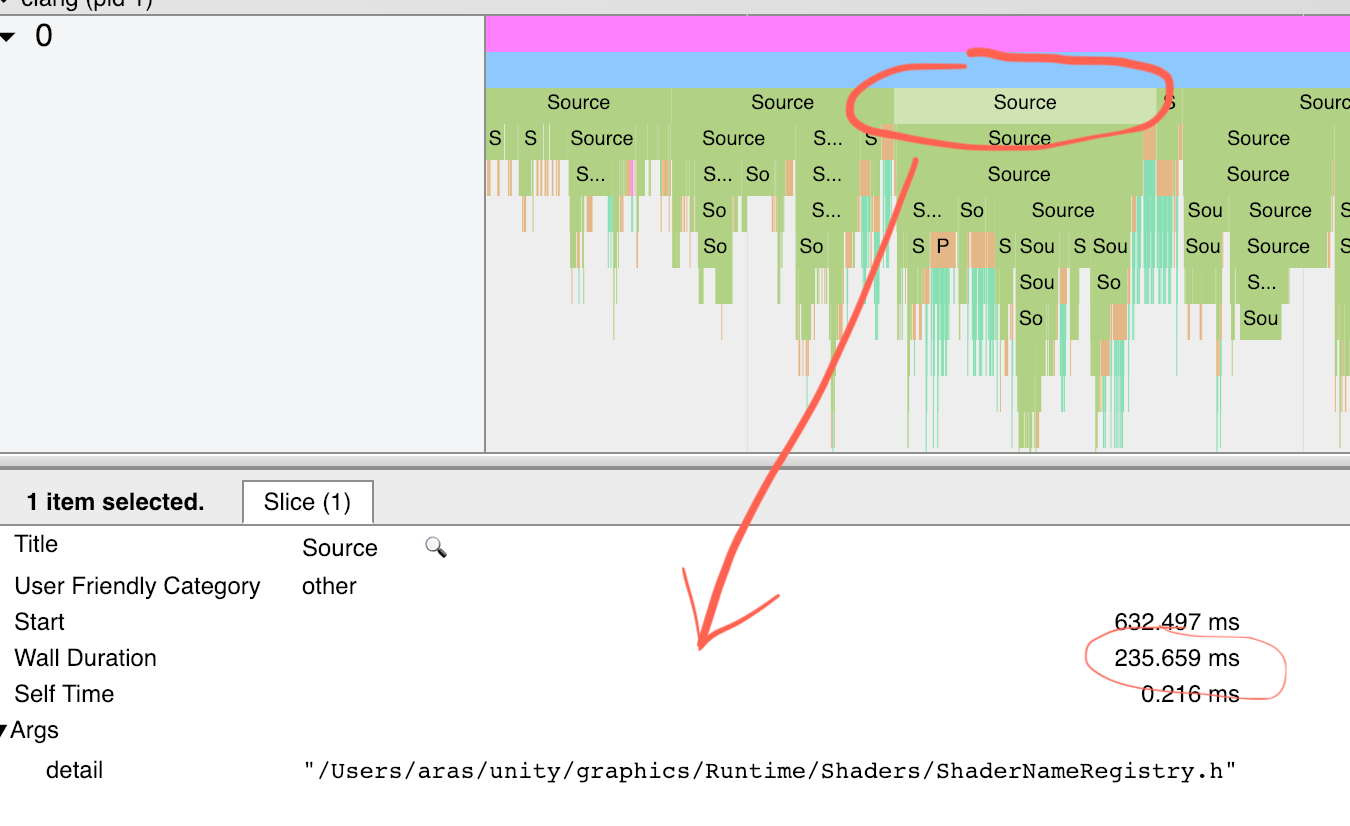
Already found some headers that took longer to process than you’d guess, and I’ve split them up into “rarely used, expensive” parts and “often used, cheap” parts.
Or when looking at template instantiations, I can see which ones end up taking most time to process, and focus on improving them:
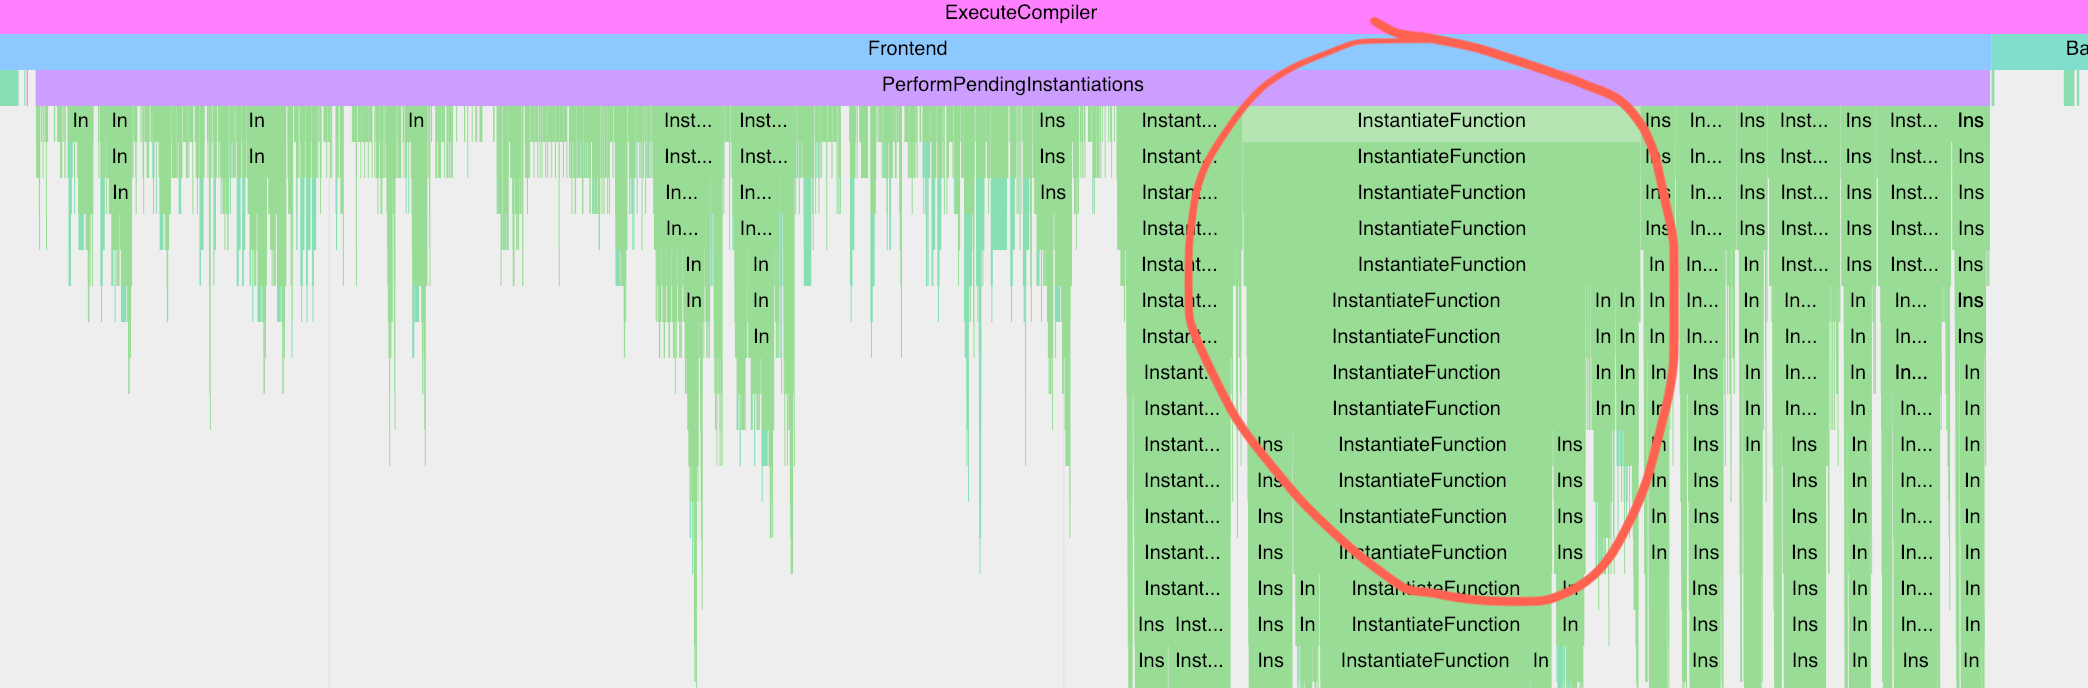
Ok where’s the code, and what now?
All the code is at this github PR for now, which is based on Clang 8.0.0-ish “trunk” as it was on 2019 January 10.
It adds a new command line flag to clang, -ftime-trace, that produces Chrome Tracing .json file next to the regular compiled object files.
I based it on the older LLVM/Clang “git monorepo”; they have switched to another github repository while I was doing it :) However the build instructions are the same as for regular LLVM/Clang. Some notes:
-
Do use Ninja backend for building. Default Makefiles backend spends ages figuring out what to build, every time you do the build.
-
Default build type is non-optimized Debug build. Build optimized Release build with the usual
-DCMAKE_BUILD_TYPE=RelWithDebInfoCMake flag. -
LLVM/Clang build is setup in such a way where any changes to the base “Support” library (where timing/profiling utilities are, among other things) cause rebuild of almost everything. Add a comment into Timer.cpp file? There’s 2500 files to recompile! And I wanted to add my profiling stuff in there…
-
Overall this was surprisingly easy! I mean I’ve never built LLVM/Clang before, and here, just 350 lines of code later, I have my own modified Clang with the profiling output I always wanted. Pretty good!
I’ve started a thread on Clang mailing list about my changes, and will see where that goes. There are some comments already; at some point I’d have to do a proper pull request via whatever is the LLVM/Clang code review tooling.
No idea whether any of this will get accepted into upstream Clang, but if not, then at least I will have my own Clang with the profiler I always wanted.
Clang Build Analyzer
Adds -ftime-trace option to clang that produces Chrome chrome://tracing compatible JSON profiling output dumps. (在 chrome://tracing/ 页面加载编译时输出的 *.json 文件,注意不是 ClangBuildAnalyzer --stop . test.json 执行后生成的二进制的 test.json 文件)
I have written about how existing -ftime-report is not very useful, when one is not a compiler developer (see blog post). As a user, when I’m investigating compile times, I’m most interested in “What and where in my code things are slow to compile?” The existing -ftime-report only partially answers the “what” part, and does not answer the “where” part at all.
Clang C/C++ build analysis tool when using Clang 9+ -ftime-trace. The -ftime-trace compiler flag (see blog post or Clang 9 release notes) can be useful to figure out what takes time during compilation of one source file. This tool helps to aggregate time trace reports from multiple compilations, and output “what took the most time” summary:
- Which files are slowest to parse? i.e. spend time in compiler lexer/parser front-end
- Which C++ templates took the most time to instantiate?
- Which files are slowest to generate code for? i.e. spend time in compiler backend doing codegen and optimizations
- Which functions are slowest to generate code for?
- Which header files are included the most in the whole build, how much time is spent parsing them, and what are the include chains of them?
Usage:
#!/bin/bash

# -ftime-report
# clang++ -std=c++11 -g -O2 -ftime-report -c test.cc -o test.o
# clang++ test.o -o test


# -ftime-trace
#
# Start the build capture: ClangBuildAnalyzer --start <artifacts_folder>
# This will write current timestamp in a ClangBuildAnalyzerSession.txt file under the given artifacts_folder.
# The artifacts folder is where the compiled object files (and time trace report files) are expected to be produced by your build.
./ClangBuildAnalyzer --start .

# Do your build
clang++ -std=c++11 -g -O2 -ftime-trace -c test.cc
clang++ test.o -o test

# Stop the build capture: ClangBuildAnalyzer --stop <artifacts_folder> <capture_file>
# This will load all Clang time trace compatible *.json files under the given artifacts_folder that were modified after --start step was done
# (Clang -ftime-trace produces one JSON file next to each object file), process them and store data file into a binary capture_file.
./ClangBuildAnalyzer --stop . test.json

# Run the build analysis: ClangBuildAnalyzer --analyze <capture_file>
# This will read the capture_file produced by --stop step, calculate the slowest things and print them.
# If a ClangBuildAnalyzer.ini file exists in the current folder, it will be read to control how many of various things to print.
./ClangBuildAnalyzer --analyze test.json

# Aternatively, instead of doing --start and --stop steps, you can do ClangBuildAnalyzer --all <artifacts_folder> <capture_file> after your build;
# that will include all the compatible *.json files for analysis, no matter when they were produced.
Analysis Output:
Build tracing started. Do some Clang builds with '-ftime-trace', then run 'ClangBuildAnalyzer --stop . <filename>' to stop tracing and save session to a file.
Stopping build tracing and saving to 'test.json'...
  done in 0.0s. Run 'ClangBuildAnalyzer --analyze test.json' to analyze it.
Analyzing build trace from 'test.json'...
**** Time summary:
Compilation (1 times):
  Parsing (frontend):            1.0 s
  Codegen & opts (backend):      2.9 s

**** Files that took longest to parse (compiler frontend):
  1041 ms: ./test.json

**** Files that took longest to codegen (compiler backend):
  2889 ms: ./test.json

**** Templates that took longest to instantiate:
   475 ms: std::__cxx11::basic_regex<char, std::__cxx11::regex_traits<char>>::b... (2 times, avg 237 ms)
   237 ms: std::__cxx11::basic_regex<char, std::__cxx11::regex_traits<char>>::b... (1 times, avg 237 ms)
   236 ms: std::__detail::__compile_nfa<std::__cxx11::regex_traits<char>, const... (1 times, avg 236 ms)
   229 ms: std::__detail::_Compiler<std::__cxx11::regex_traits<char>>::_Compiler (1 times, avg 229 ms)
   184 ms: std::__detail::_Compiler<std::__cxx11::regex_traits<char>>::_M_disju... (1 times, avg 184 ms)
   183 ms: std::__detail::_Compiler<std::__cxx11::regex_traits<char>>::_M_alter... (1 times, avg 183 ms)
   181 ms: std::__detail::_Compiler<std::__cxx11::regex_traits<char>>::_M_term (1 times, avg 181 ms)
   149 ms: std::__detail::_Compiler<std::__cxx11::regex_traits<char>>::_M_atom (1 times, avg 149 ms)
    65 ms: std::__detail::_Compiler<std::__cxx11::regex_traits<char>>::_M_inser... (1 times, avg 65 ms)
    31 ms: std::__detail::_Compiler<std::__cxx11::regex_traits<char>>::_M_quant... (1 times, avg 31 ms)
    29 ms: std::__detail::_Compiler<std::__cxx11::regex_traits<char>>::_M_brack... (1 times, avg 29 ms)
    22 ms: std::__detail::_StateSeq<std::__cxx11::regex_traits<char>>::_M_clone (1 times, avg 22 ms)
    20 ms: std::__detail::_BracketMatcher<std::__cxx11::regex_traits<char>, fal... (1 times, avg 20 ms)
    18 ms: std::map<long, long, std::less<long>, std::allocator<std::pair<const... (1 times, avg 18 ms)
    17 ms: std::__detail::_BracketMatcher<std::__cxx11::regex_traits<char>, fal... (1 times, avg 17 ms)
    16 ms: std::__detail::_Compiler<std::__cxx11::regex_traits<char>>::_M_inser... (1 times, avg 16 ms)
    15 ms: std::__detail::_Compiler<std::__cxx11::regex_traits<char>>::_M_inser... (1 times, avg 15 ms)
    14 ms: std::__detail::_Compiler<std::__cxx11::regex_traits<char>>::_M_expre... (1 times, avg 14 ms)
    13 ms: std::__detail::_Scanner<char>::_Scanner (1 times, avg 13 ms)
    13 ms: std::_Rb_tree<long, std::pair<const long, long>, std::_Select1st<std... (1 times, avg 13 ms)
    13 ms: std::__cxx11::regex_traits<char>::lookup_classname<const char *> (1 times, avg 13 ms)
    12 ms: std::unordered_map<std::__cxx11::basic_string<char>, double, std::ha... (1 times, avg 12 ms)
    12 ms: std::_Hashtable<std::__cxx11::basic_string<char>, std::pair<const st... (1 times, avg 12 ms)
    11 ms: std::__detail::_NFA<std::__cxx11::regex_traits<char>>::_M_insert_sub... (1 times, avg 11 ms)
    11 ms: std::_Hashtable<std::__cxx11::basic_string<char>, std::pair<const st... (1 times, avg 11 ms)
     9 ms: std::__detail::_Compiler<std::__cxx11::regex_traits<char>>::_M_inser... (1 times, avg 9 ms)
     9 ms: std::__detail::_BracketMatcher<std::__cxx11::regex_traits<char>, fal... (1 times, avg 9 ms)
     9 ms: std::_Rb_tree<long, std::pair<const long, long>, std::_Select1st<std... (1 times, avg 9 ms)
     9 ms: std::__detail::_Compiler<std::__cxx11::regex_traits<char>>::_M_expre... (1 times, avg 9 ms)
     8 ms: std::__detail::_BracketMatcher<std::__cxx11::regex_traits<char>, fal... (1 times, avg 8 ms)

**** Template sets that took longest to instantiate:
   237 ms: std::__cxx11::basic_regex<$>::basic_regex (1 times, avg 237 ms)
   237 ms: std::__cxx11::basic_regex<$>::basic_regex<$> (1 times, avg 237 ms)
   236 ms: std::__detail::__compile_nfa<$> (1 times, avg 236 ms)
   229 ms: std::__detail::_Compiler<$>::_Compiler (1 times, avg 229 ms)
   184 ms: std::__detail::_Compiler<$>::_M_disjunction (1 times, avg 184 ms)
   183 ms: std::__detail::_Compiler<$>::_M_alternative (1 times, avg 183 ms)
   181 ms: std::__detail::_Compiler<$>::_M_term (1 times, avg 181 ms)
   149 ms: std::__detail::_Compiler<$>::_M_atom (1 times, avg 149 ms)
    90 ms: std::__detail::_Compiler<$>::_M_insert_character_class_matcher<$> (4 times, avg 22 ms)
    31 ms: std::vector<$>::push_back (8 times, avg 3 ms)
    31 ms: std::__detail::_Compiler<$>::_M_quantifier (1 times, avg 31 ms)
    29 ms: std::__detail::_Compiler<$>::_M_bracket_expression (1 times, avg 29 ms)
    29 ms: std::__detail::_Compiler<$>::_M_insert_bracket_matcher<$> (4 times, avg 7 ms)
    28 ms: std::__detail::_BracketMatcher<$>::_M_ready (4 times, avg 7 ms)
    28 ms: std::function<$>::function<$> (16 times, avg 1 ms)
    26 ms: std::__detail::_Compiler<$>::_M_expression_term<$> (4 times, avg 6 ms)
    23 ms: std::vector<$>::_M_realloc_insert<$> (8 times, avg 2 ms)
    22 ms: std::__detail::_StateSeq<$>::_M_clone (1 times, avg 22 ms)
    19 ms: std::vector<$>::emplace_back<$> (5 times, avg 3 ms)
    18 ms: std::map<long, long, std::less<long>, std::allocator<std::pair<const... (1 times, avg 18 ms)
    18 ms: std::vector<$>::vector (13 times, avg 1 ms)
    17 ms: std::__detail::_BracketMatcher<$>::_M_add_character_class (1 times, avg 17 ms)
    17 ms: std::__detail::_BracketMatcher<$>::_M_make_cache (4 times, avg 4 ms)
    16 ms: std::make_pair<$> (6 times, avg 2 ms)
    16 ms: std::__uninitialized_move_if_noexcept_a<$> (8 times, avg 2 ms)
    15 ms: std::__detail::_BracketMatcher<$>::_M_apply (4 times, avg 3 ms)
    14 ms: std::__detail::_BracketMatcher<$>::_M_make_range (2 times, avg 7 ms)
    13 ms: std::__detail::_Scanner<$>::_Scanner (1 times, avg 13 ms)
    13 ms: std::__uninitialized_copy_a<$> (14 times, avg 0 ms)
    13 ms: std::pair<$> (12 times, avg 1 ms)

**** Functions that took longest to compile:
    88 ms: std::__detail::_Compiler<std::__cxx11::regex_traits<char> >::_M_quan... (test.cc)
    66 ms: std::__detail::_StateSeq<std::__cxx11::regex_traits<char> >::_M_clon... (test.cc)
    57 ms: bool std::__detail::_Compiler<std::__cxx11::regex_traits<char> >::_M... (test.cc)
    56 ms: bool std::__detail::_Compiler<std::__cxx11::regex_traits<char> >::_M... (test.cc)
    39 ms: std::__detail::_Compiler<std::__cxx11::regex_traits<char> >::_M_atom() (test.cc)
    39 ms: void std::__detail::_Compiler<std::__cxx11::regex_traits<char> >::_M... (test.cc)
    38 ms: void std::__detail::_Compiler<std::__cxx11::regex_traits<char> >::_M... (test.cc)
    30 ms: std::__detail::_BracketMatcher<std::__cxx11::regex_traits<char>, fal... (test.cc)
    30 ms: std::__detail::_BracketMatcher<std::__cxx11::regex_traits<char>, tru... (test.cc)
    29 ms: std::__detail::_Compiler<std::__cxx11::regex_traits<char> >::_M_asse... (test.cc)
    27 ms: void std::__detail::_Compiler<std::__cxx11::regex_traits<char> >::_M... (test.cc)
    27 ms: void std::__detail::_Compiler<std::__cxx11::regex_traits<char> >::_M... (test.cc)
    27 ms: std::__detail::_Compiler<std::__cxx11::regex_traits<char> >::_Compil... (test.cc)
    25 ms: void std::__detail::_Compiler<std::__cxx11::regex_traits<char> >::_M... (test.cc)
    24 ms: void std::__detail::_Compiler<std::__cxx11::regex_traits<char> >::_M... (test.cc)
    24 ms: std::__detail::_BracketMatcher<std::__cxx11::regex_traits<char>, fal... (test.cc)
    23 ms: bool std::__detail::_Compiler<std::__cxx11::regex_traits<char> >::_M... (test.cc)
    23 ms: bool std::__detail::_Compiler<std::__cxx11::regex_traits<char> >::_M... (test.cc)
    22 ms: void std::vector<std::pair<std::__cxx11::basic_string<char, std::cha... (test.cc)
    22 ms: std::__detail::_BracketMatcher<std::__cxx11::regex_traits<char>, tru... (test.cc)
    22 ms: void std::__introsort_loop<__gnu_cxx::__normal_iterator<char*, std::... (test.cc)
    21 ms: std::__detail::_BracketMatcher<std::__cxx11::regex_traits<char>, fal... (test.cc)
    20 ms: std::__detail::_Scanner<char>::_M_eat_escape_ecma() (test.cc)
    20 ms: std::__detail::_BracketMatcher<std::__cxx11::regex_traits<char>, tru... (test.cc)
    18 ms: void std::vector<std::__cxx11::basic_string<char, std::char_traits<c... (test.cc)
    18 ms: main (test.cc)
    18 ms: std::__detail::_BracketMatcher<std::__cxx11::regex_traits<char>, tru... (test.cc)
    17 ms: std::__detail::_BracketMatcher<std::__cxx11::regex_traits<char>, fal... (test.cc)
    16 ms: std::__detail::_BracketMatcher<std::__cxx11::regex_traits<char>, fal... (test.cc)
    16 ms: std::__detail::_BracketMatcher<std::__cxx11::regex_traits<char>, tru... (test.cc)

**** Function sets that took longest to compile / optimize:
   161 ms: bool std::__detail::_Compiler<$>::_M_expression_term<$>(std::pair<$>... (4 times, avg 40 ms)
   127 ms: void std::__detail::_Compiler<$>::_M_insert_bracket_matcher<$>(bool) (4 times, avg 31 ms)
   105 ms: std::__detail::_BracketMatcher<$>::_BracketMatcher(std::__detail::_B... (4 times, avg 26 ms)
    88 ms: std::__detail::_Compiler<$>::_M_quantifier() (1 times, avg 88 ms)
    87 ms: void std::__detail::_Compiler<$>::_M_insert_character_class_matcher<... (4 times, avg 21 ms)
    67 ms: std::__detail::_BracketMatcher<$>::_M_add_character_class(std::__cxx... (4 times, avg 16 ms)
    66 ms: std::__detail::_StateSeq<$>::_M_clone() (1 times, avg 66 ms)
    63 ms: std::__detail::_BracketMatcher<$>::_M_make_range(char, char) (4 times, avg 15 ms)
    45 ms: std::__detail::_BracketMatcher<$>::_M_ready() (4 times, avg 11 ms)
    44 ms: std::__detail::_BracketMatcher<$>::_M_add_equivalence_class(std::__c... (4 times, avg 11 ms)
    39 ms: std::__detail::_Compiler<$>::_M_atom() (1 times, avg 39 ms)
    31 ms: std::__detail::_BracketMatcher<$>::_M_add_collate_element(std::__cxx... (4 times, avg 7 ms)
    29 ms: std::__detail::_Compiler<$>::_M_assertion() (1 times, avg 29 ms)
    28 ms: std::_Function_base::_Base_manager<$>::_M_manager(std::_Any_data&, s... (16 times, avg 1 ms)
    27 ms: std::__detail::_Compiler<$>::_Compiler(char const*, char const*, std... (1 times, avg 27 ms)
    24 ms: void std::vector<$>::_M_realloc_insert<$>(__gnu_cxx::__normal_iterat... (2 times, avg 12 ms)
    24 ms: std::__detail::_BracketMatcher<std::__cxx11::regex_traits<char>, fal... (1 times, avg 24 ms)
    23 ms: void std::__detail::_Compiler<$>::_M_insert_char_matcher<$>() (4 times, avg 5 ms)
    22 ms: void std::__detail::_Compiler<$>::_M_insert_any_matcher_ecma<$>() (4 times, avg 5 ms)
    22 ms: void std::__introsort_loop<$>(__gnu_cxx::__normal_iterator<$>, __gnu... (1 times, avg 22 ms)
    21 ms: void std::__detail::_Compiler<$>::_M_insert_any_matcher_posix<$>() (4 times, avg 5 ms)
    20 ms: std::__detail::_Scanner<$>::_M_eat_escape_ecma() (1 times, avg 20 ms)
    20 ms: std::__detail::_BracketMatcher<std::__cxx11::regex_traits<char>, tru... (1 times, avg 20 ms)
    18 ms: void std::vector<$>::_M_realloc_insert<$>(__gnu_cxx::__normal_iterat... (1 times, avg 18 ms)
    18 ms: std::__detail::_BracketMatcher<std::__cxx11::regex_traits<char>, tru... (1 times, avg 18 ms)
    16 ms: std::__detail::_BracketMatcher<$>::~_BracketMatcher() (4 times, avg 4 ms)
    15 ms: std::__detail::_Scanner<$>::_M_scan_normal() (1 times, avg 15 ms)
    15 ms: std::__detail::_Compiler<$>::_M_disjunction() (1 times, avg 15 ms)
    15 ms: std::__detail::_BracketMatcher<std::__cxx11::regex_traits<char>, fal... (1 times, avg 15 ms)
    15 ms: std::__cxx11::regex_traits<$>::_RegexMask std::__cxx11::regex_traits... (1 times, avg 15 ms)

**** Expensive headers:
437 ms: /usr/include/c++/8/regex (included 1 times, avg 437 ms), included via:
  1x: <direct include>

34 ms: /usr/include/c++/8/unordered_map (included 1 times, avg 34 ms), included via:
  1x: <direct include>

  done in 0.0s.
Granularity (粒度) and amount of most expensive things (files, functions, templates, includes) that are reported can be controlled by having an ClangBuildAnalyzer.ini file in the working directory. Take a look at ClangBuildAnalyzer.ini for an example.
# ClangBuildAnalyzer reads ClangBuildAnalyzer.ini file from the working directory
# when invoked, and various aspects of reporting can be configured this way.
# This file example is setup to be exactly like what the defaults are.

# How many of most expensive things are reported?
[counts]

# files that took most time to parse
fileParse = 10
# files that took most time to generate code for
fileCodegen = 10
# functions that took most time to generate code for
function = 30
# header files that were most expensive to include
header = 10
# for each expensive header, this many include paths to it are shown
headerChain = 5
# templates that took longest to instantiate
template = 30


# Minimum times (in ms) for things to be recorded into trace
[minTimes]

# parse/codegen for a file
file = 10


[misc]

# Maximum length of symbol names printed; longer names will get truncated
maxNameLength = 70

# Only print "root" headers in expensive header report, i.e.
# only headers that are directly included by at least one source file
onlyRootHeaders = true
Q&A
Relocation overflow and code models
There are several strategies to mitigate relocation overflow issues.
- Make the program smaller by reducing code and data size.
- Partition the large monolithic executable into the main executable and a few shared objects.
- Switch to the medium code model
- Use compiler options such as
-Os,-Ozand link-time optimization that focuses on decreasing the code size. - For compiler instrumentations (e.g.
-fsanitize=address,-fprofile-generate), move some data to large data sections. - Use linker script commands
INSERT BEFOREandINSERT AFTERto reorder output sections.
在某些情况下,当静态链接的二进制文件超过2GB时,可能会遇到relocation overflow问题。这是因为在大型程序中,某些指针和地址可能超出了编译器为其分配的空间。为了解决这个问题,可以尝试以下方法:
- 使用大型模型或大型地址空间:在编译时,可以选择使用大型模型(例如-mcmodel=large)或大型地址空间(例如-mlarge-address-aware)。这将允许编译器和链接器使用更大的地址空间,以便处理大型程序。具体的编译选项可能因编译器而异,请参阅编译器文档以获取适当的选项。
- 分割程序:如果可能,将程序分割成多个较小的模块或库。这可以减小每个模块的大小,降低relocation overflow的风险。此外,使用动态链接库(DLL)或共享对象(SO)可以进一步减小二进制文件的大小。
- 优化代码:检查代码以查找潜在的优化点,例如删除未使用的代码、减少全局变量的使用、优化数据结构和算法等。这可以帮助减小二进制文件的大小,从而降低relocation overflow的风险。
- 更新编译器和链接器:确保使用的编译器和链接器是最新版本,因为它们可能包含解决relocation overflow问题的修复和改进。此外,尝试使用其他编译器,看看它们是否能更好地处理大型程序。
- 考虑使用动态链接:虽然静态链接可以将所有依赖项打包到单个二进制文件中,但它可能导致文件过大。如果可能,考虑改用动态链接,将依赖项链接为共享库或动态链接库。这样可以减小二进制文件的大小,并减轻relocation overflow问题。
请注意,解决relocation overflow问题可能需要对代码、编译选项和链接过程进行多方面的调整。在尝试上述方法时,请根据具体情况选择合适的策略。
Refer
- C++ 服务编译耗时优化原理及实践 (美团)