iPerf in Action
iperf3: A TCP, UDP, and SCTP network bandwidth measurement tool
iperf is a tool for active measurements of the maximum achievable bandwidth on IP networks. It supports tuning of various parameters related to timing, protocols, and buffers. For each test it reports the measured throughput / bitrate, loss, and other parameters.
This version, sometimes referred to as iperf3, is a redesign of an original version developed at NLANR/DAST. iperf3 is a new implementation from scratch, with the goal of a smaller, simpler code base, and a library version of the functionality that can be used in other programs. iperf3 also has a number of features found in other tools such as nuttcp and netperf, but were missing from the original iperf. These include, for example, a zero-copy mode and optional JSON output. Note that iperf3 is not backwards compatible with the original iperf.
Primary development for iperf3 takes place on Ubuntu Linux, FreeBSD, and macOS. At this time, these are the only officially supported platforms, however there have been some reports of success with OpenBSD, NetBSD, Android, Solaris, and other Linux distributions.
iperf3 is principally developed by ESnet / Lawrence Berkeley National Laboratory. It is released under a three-clause BSD license.
iperf 是一款广泛使用的开源网络性能测试工具,它采用客户端-服务器(C/S)模型,可以测量网络的带宽、吞吐量、延迟、抖动和数据包丢失等关键指标。它支持 TCP、UDP 和 SCTP 协议,常用于评估路由器、防火墙、交换机等网络设备的性能。
它的开发和维护主要在 GitHub - esnet/iperf 项目上进行。目前,iperf3 是主要维护和使用的版本,它与早期 iperf 版本在功能和命令上略有不同,以下介绍均以 iperf3 为主。
Download
Downloads of iperf3 are available at: https://downloads.es.net/pub/iperf/
Build
- Prerequisites: None
- Building:
./configure; make; make install
Note: If configure fails, try running ./bootstrap.sh first
Invoking iperf3
iperf3 includes a manual page listing all of the command-line options. The manual page is the most up-to-date reference to the various flags and parameters.
For sample command line usage, see: https://fasterdata.es.net/performance-testing/network-troubleshooting-tools/iperf/
Using the default options, iperf is meant to show typical well designed application performance. “Typical well designed application” means avoiding artificial enhancements that work only for testing (such as splice()’ing the data to /dev/null). iperf does also have flags for “extreme best case” optimizations, but they must be explicitly activated.
These flags include:
-Z, --zerocopy            use a 'zero copy' sendfile() method of sending data
-A, --affinity n/n,m      set CPU affinity
Quick Start
一个典型的 iperf 测试需要两台主机:一台作为服务器(接收数据),另一台作为客户端(发送数据)。
基本测试流程:
- 在服务器端启动服务:执行命令
iperf3 -s,服务器会开始监听默认的 5201 端口。 - 在客户端发起测试:执行命令
iperf3 -c <服务器 IP>,其中<服务器 IP>需要替换为服务器所在机器的实际 IP。
iperf3 提供了丰富的参数来满足不同的测试需求:
| 场景 | 常用参数组合 | 参数说明 |
|---|---|---|
| 最简 TCP 测试 | iperf3 -c <服务器 IP> |
进行默认 10 秒的 TCP 带宽测试 |
| 指定测试时长 | iperf3 -c <服务器 IP> -t 30 |
-t 30:将测试时间延长至 30 秒 |
| 多线程并行 | iperf3 -c <服务器 IP> -P 4 |
-P 4:使用 4 个并行连接来压榨网络潜力 |
| UDP 带宽与丢包 | iperf3 -c <服务器 IP> -u -b 100M |
-u:使用 UDP 协议 -b 100M:将 UDP 传输速率限制为 100 Mbps |
| 测试下行带宽 | iperf3 -c <服务器 IP> -R |
-R (Reverse):反向测试模式,让服务器发送数据,客户端接收,测试下行带宽 |
| 更改服务器端口 | iperf3 -c <服务器 IP> -p 5202 |
-p 5202:连接至服务器非默认的 5202 端口 |
| 输出 JSON 报告 | iperf3 -c <服务器 IP> -i 1 -J > result.json |
-i 1:每秒输出一次报告 -J:以 JSON 格式输出,便于脚本分析 > result.json:将结果保存到文件 |
注意事项:
- iperf 使用的端口(默认 TCP 和 UDP 的 5201 端口)
- 在 TCP 测试中,重点关注 Bitrate(比特率)来衡量带宽
- 在 UDP 测试中,除了带宽,还需关注
Jitter(抖动,即延迟变化)和Lost/Total Datagrams(丢包率) - 上述示例均为客户端命令。服务器端通常只需简单地启动服务(
iperf3 -s),但也可绑定特定端口(-p)或作为守护进程运行(-D,仅限类 Unix 系统)。
测试 UDP 每秒发送 N 个数据包
方法1:PPS = 目标带宽 (bps) / 单个数据包的总比特数
可以通过下面的公式计算出大致的 PPS:PPS ≈ 目标带宽 (bps) / (数据包长度 (字节) × 8 + 数据包头开销)
更简便的方法是:PPS = 目标带宽 (bps) / 单个数据包的总比特数
数据包头开销(通常是 IP 头 20 字节和 UDP 头 8 字节)在实际粗略计算中有时会被忽略,但需要知道它的存在。
假设实现以下测试场景:
- 目标 PPS:每秒发送 10000 个数据包
- 每个数据包大小:512 字节(仅数据部分,使用
-l 512) - 测试持续时间:10秒
计算所需目标带宽:
单个数据包的总比特数 = 数据包长度 × 8 = 512 × 8 = 4096 bits。
目标带宽 = PPS × 单个数据包的总比特数 = 10000 × 4096 = 40,960,000 bps = 40.96 Mbps。
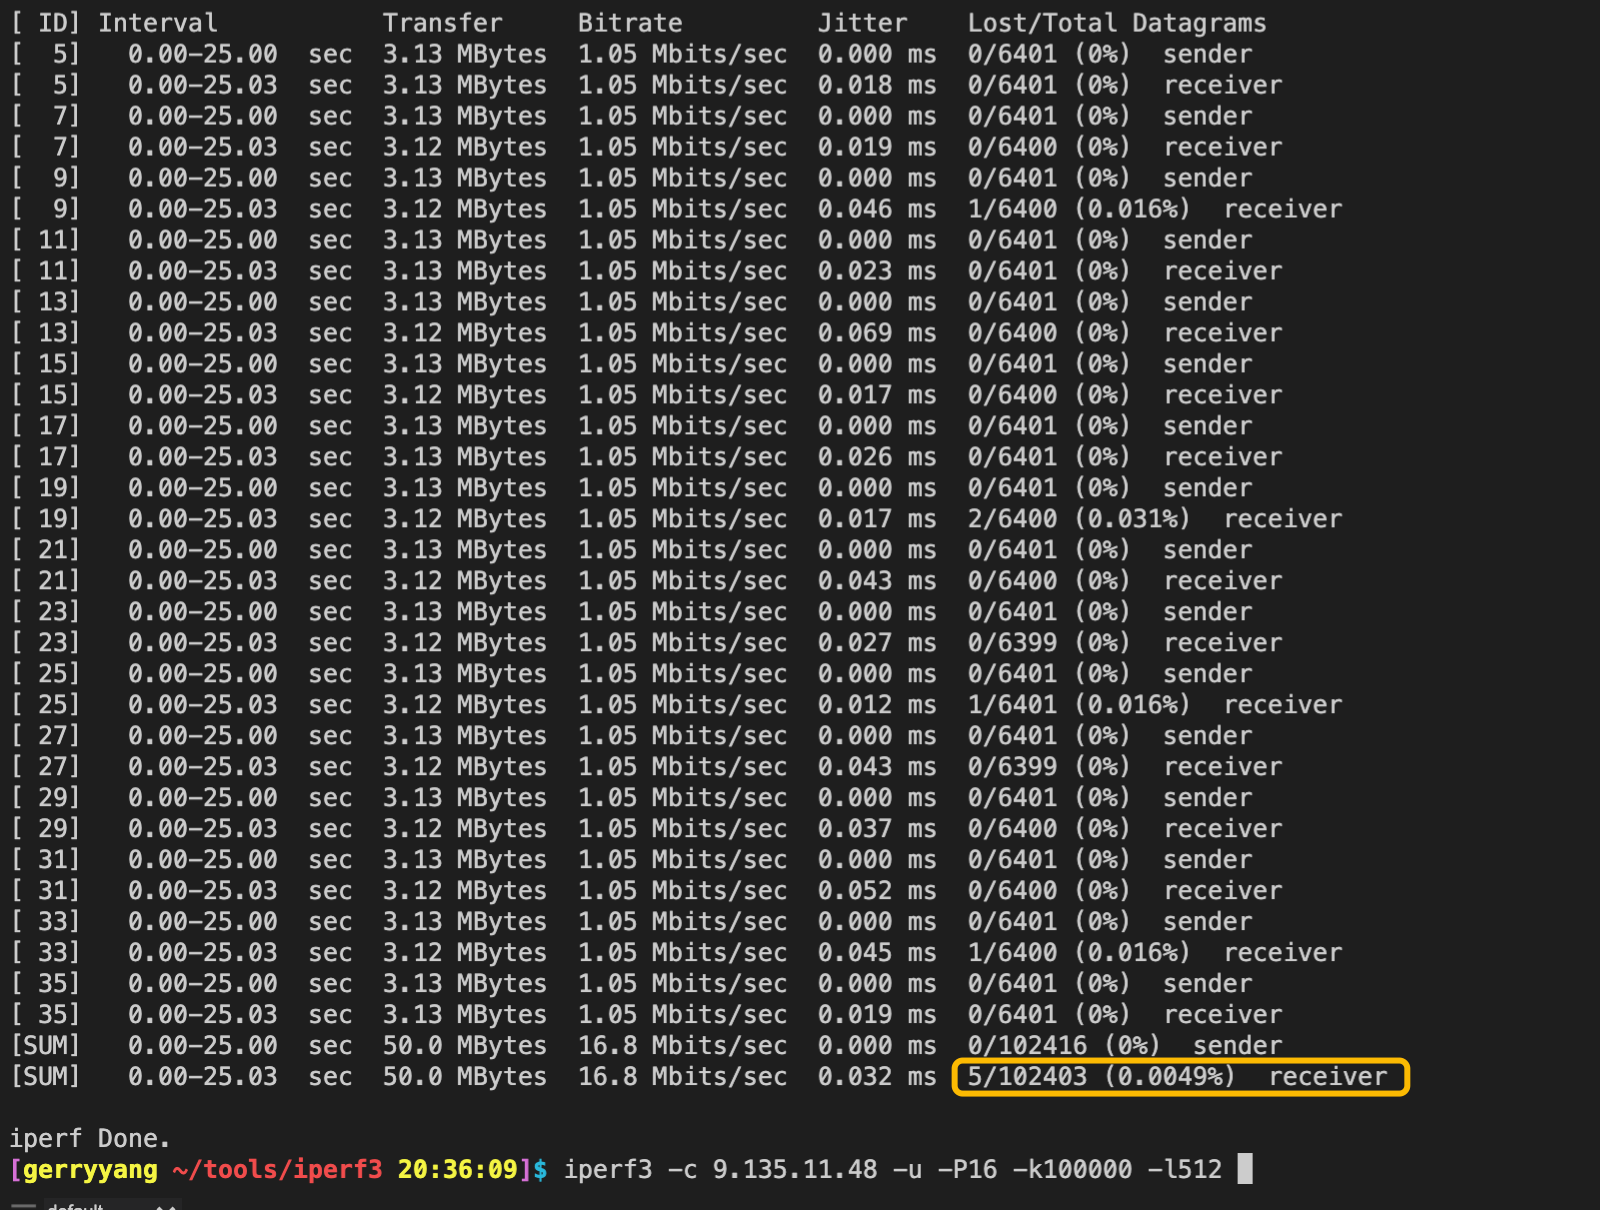
测试命令为:iperf3 -c your_ip -u -P16 -t10 -b40.96M -l512
客户端测试结果:
注意:
- 此方法仅在使用 UDP 协议时有效。TCP 是面向流的协议,会自行决定分段大小,不适用于按包控制。
- 实际 PPS 的波动:
-b参数在 UDP 模式下限制的是发送速率。实际 PPS 可能会因系统负载、网络状况等因素有微小波动。iperf3 会尽力维持你设定的带宽,从而逼近目标 PPS。
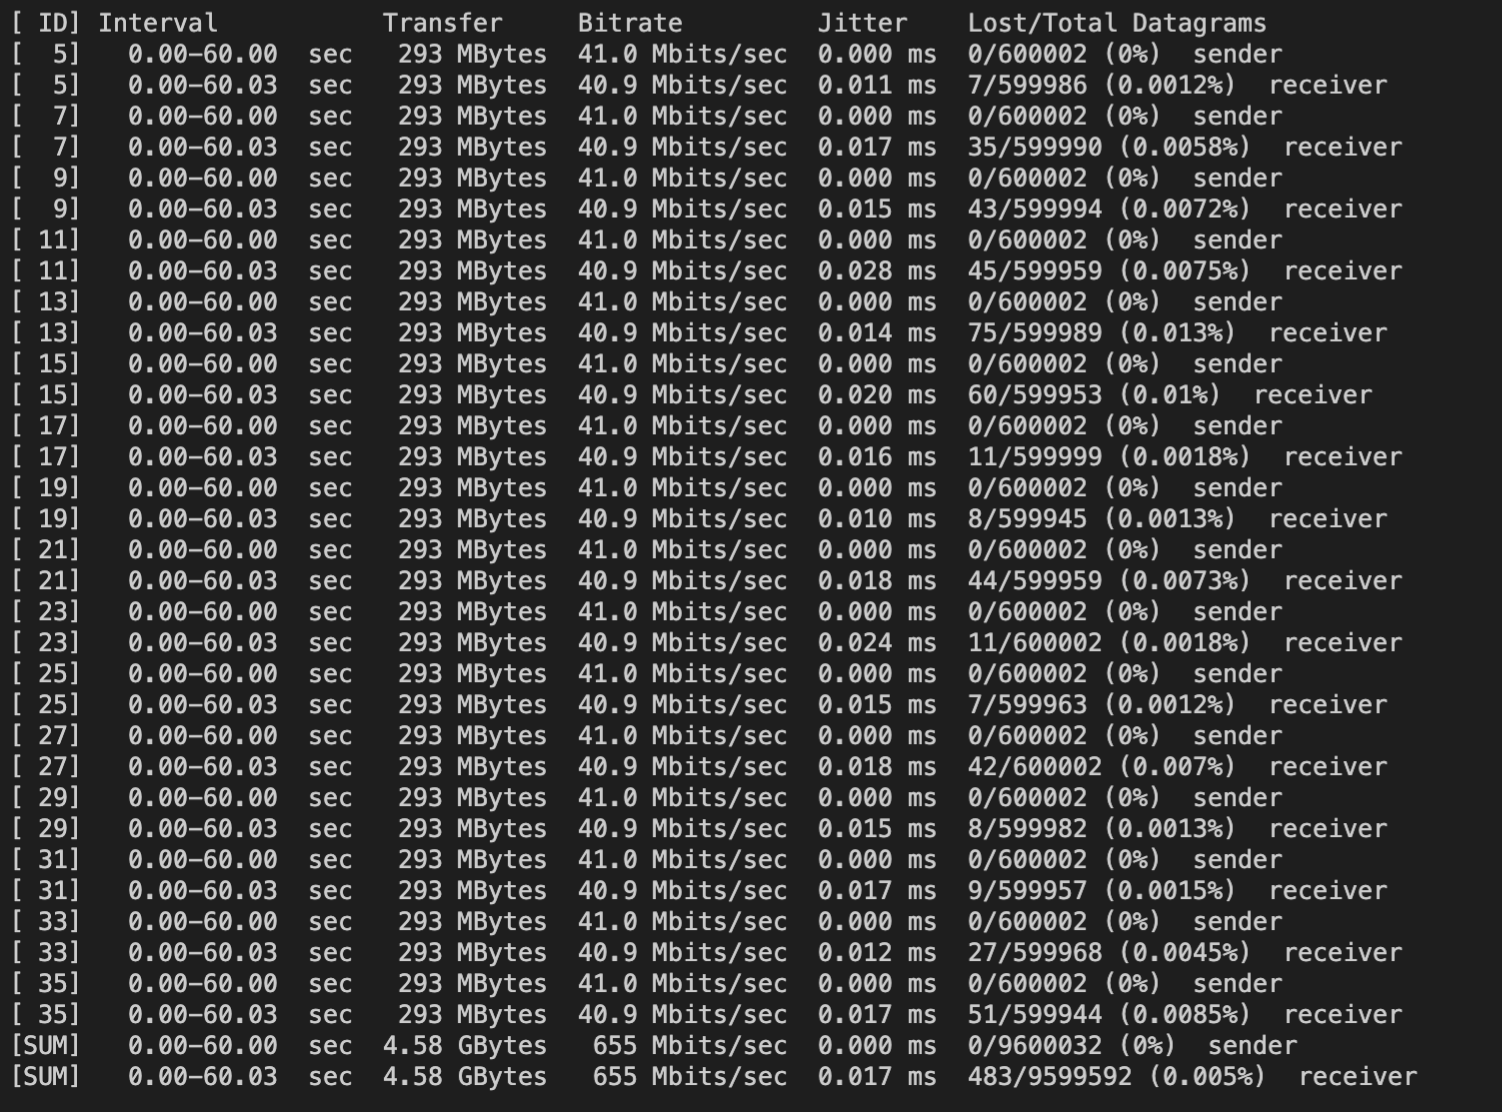
方法2:指定传输的数据包数量
可看到 -k (--blockcount) 参数用于指定传输的数据包数量。例如 -k 1000 会发送 1000 个包后结束。
测试命令为:iperf3 -c 9.135.11.48 -u -P16 -k10000 -l512
注意:终止条件的参数只能指定一个。如果输入多个终止参数会遇到错误提示:
only one test end condition (-t, -n, -k) may be specified
客户端测试结果:
服务端测试结果:

Usage
$ iperf3 -h
Usage: iperf3 [-s|-c host] [options]
       iperf3 [-h|--help] [-v|--version]

Server or Client:
  -p, --port      #         server port to listen on/connect to
  -f, --format   [kmgtKMGT] format to report: Kbits, Mbits, Gbits, Tbits
  -i, --interval  #         seconds between periodic throughput reports
  -I, --pidfile file        write PID file
  -F, --file name           xmit/recv the specified file
  -A, --affinity n[,m]      set CPU affinity core number to n (the core the process will use)
                             (optional Client only m - the Server's core number for this test)
  -B, --bind <host>[%<dev>] bind to the interface associated with the address <host>
                            (optional <dev> equivalent to `--bind-dev <dev>`)
  --bind-dev <dev>          bind to the network interface with SO_BINDTODEVICE
  -V, --verbose             more detailed output
  -J, --json                output in JSON format
  --json-stream             output in line-delimited JSON format
  --logfile f               send output to a log file
  --forceflush              force flushing output at every interval
  --timestamps<=format>     emit a timestamp at the start of each output line
                            (optional "=" and format string as per strftime(3))
  --rcv-timeout #           idle timeout for receiving data (default 120000 ms)
  --snd-timeout #           timeout for unacknowledged TCP data
                            (in ms, default is system settings)
  --cntl-ka[=#/#/#]         use control connection TCP keepalive - KEEPIDLE/KEEPINTV/KEEPCNT
                            each value is optional with system settings default
  -m, --mptcp               use MPTCP rather than plain TCP
  -d, --debug[=#]           emit debugging output
                            (optional optional "=" and debug level: 1-4. Default is 4 - all messages)
  -v, --version             show version information and quit
  -h, --help                show this message and quit
Server specific:
  -s, --server              run in server mode
  -D, --daemon              run the server as a daemon
  -1, --one-off             handle one client connection then exit
  --server-bitrate-limit #[KMG][/#]   server's total bit rate limit (default 0 = no limit)
                            (optional slash and number of secs interval for averaging
                            total data rate.  Default is 5 seconds)
  --idle-timeout #          restart idle server after # seconds in case it
                            got stuck (default - no timeout)
  --rsa-private-key-path    path to the RSA private key used to decrypt
                            authentication credentials
  --authorized-users-path   path to the configuration file containing user
                            credentials
  --time-skew-threshold     time skew threshold (in seconds) between the server
                            and client during the authentication process
  --use-pkcs1-padding       use pkcs1 padding at your own risk
Client specific:
  -c, --client <host>[%<dev>] run in client mode, connecting to <host>
                              (option <dev> equivalent to `--bind-dev <dev>`)
  -u, --udp                 use UDP rather than TCP
  --connect-timeout #       timeout for control connection setup (ms)
  -b, --bitrate #[KMG][/#]  target bitrate in bits/sec (0 for unlimited)
                            (default 1 Mbit/sec for UDP, unlimited for TCP)
                            (optional slash and packet count for burst mode)
  --pacing-timer #[KMG]     set the Server timing for pacing, in microseconds (default 1000)
                            (deprecated - for servers using older versions ackward compatibility)
  --fq-rate #[KMG]          enable fair-queuing based socket pacing in
                            bits/sec (Linux only)
  -t, --time      #         time in seconds to transmit for (default 10 secs)
  -n, --bytes     #[KMG]    transmit until the end of the interval when the client sent or received
                            (per direction) at least this number of bytes (instead of -t or -k)
  -k, --blockcount #[KMG]   transmit until the end of the interval when the client sent or received
                            (per direction) at least this number of blocks (instead of -t or -n)
  -l, --length    #[KMG]    length of buffer to read or write
                            (default 128 KB for TCP, dynamic or 1460 for UDP)
  --cport         <port>    bind to a specific client port (TCP and UDP, default: ephemeral port)
  -P, --parallel  #         number of parallel client streams to run
  -R, --reverse             run in reverse mode (server sends, client receives)
  --bidir                   run in bidirectional mode.
                            Client and server send and receive data.
  -w, --window    #[KMG]    set send/receive socket buffer sizes
                            (indirectly sets TCP window size)
  -C, --congestion <algo>   set TCP congestion control algorithm (Linux and FreeBSD only)
  -M, --set-mss   #         set TCP/SCTP maximum segment size (MTU - 40 bytes)
  -N, --no-delay            set TCP/SCTP no delay, disabling Nagle's Algorithm
  -4, --version4            only use IPv4
  -6, --version6            only use IPv6
  -S, --tos N               set the IP type of service, 0-255.
                            The usual prefixes for octal and hex can be used,
                            i.e. 52, 064 and 0x34 all specify the same value.
  --dscp N or --dscp val    set the IP dscp value, either 0-63 or symbolic.
                            Numeric values can be specified in decimal,
                            octal and hex (see --tos above).
  -L, --flowlabel N         set the IPv6 flow label (only supported on Linux)
  -Z, --zerocopy            use a 'zero copy' method of sending data
  --skip-rx-copy            ignore received messages using MSG_TRUNC option
  -O, --omit N              perform pre-test for N seconds and omit the pre-test statistics
  -T, --title str           prefix every output line with this string
  --extra-data str          data string to include in client and server JSON
  --get-server-output       get results from server
  --udp-counters-64bit      use 64-bit counters in UDP test packets
  --repeating-payload       use repeating pattern in payload, instead of
                            randomized payload (like in iperf2)
  --dont-fragment           set IPv4 Don't Fragment flag
  --username                username for authentication
  --rsa-public-key-path     path to the RSA public key used to encrypt
                            authentication credentials

[KMG] indicates options that support a K/M/G suffix for kilo-, mega-, or giga-

iperf3 homepage at: https://software.es.net/iperf/
Report bugs to:     https://github.com/esnet/iperf
/proc/net/softnet_stat 指标统计
/proc/net/softnet_stat 是一个显示 Linux 网络软中断处理统计信息的文件。它提供了网络数据包接收处理的性能指标,对于诊断网络性能问题非常有用。
文件格式概述:
该文件每行对应一个 CPU 核心,字段以十六进制显示:
$ cat /proc/net/softnet_stat
00007b6c 00000000 00000001 00000000 00000000 00000000 00000000 00000000 00000000 00000000
0000a3d1 00000000 00000002 00000000 00000000 00000000 00000000 00000000 00000000 00000000
| 字段位置 | 十六进制含义 | 解释 |
|---|---|---|
| 字段1 | processed | 已处理的网络帧总数 |
| 字段2 | dropped | 由于内存不足等原因丢弃的帧数 |
| 字段3 | time_squeeze | net_rx_action 因预算或时间限制退出的次数 |
| 字段4 | cpu_collision | 在包传输时获取锁冲突的次数(现在较少使用) |
| 字段5 | received_rps | 通过 RPS 被其他 CPU 唤醒的次数 |
| 字段6 | flow_limit_count | 达到流限制的次数 |
注意事项
- 字段顺序可能随内核版本变化,建议在具体环境中确认
- 数值为累计值,监控时应关注变化趋势而非绝对值
- 高丢包率或挤压数 通常表明需要网络调优
- 在多核系统中,应关注各 CPU 核心的均衡性
计算丢包率
#!/bin/bash

processed=$(cat /proc/net/softnet_stat | awk '{print strtonum("0x"$1)}' | awk '{sum+=$1} END {print sum}')
dropped=$(cat /proc/net/softnet_stat | awk '{print strtonum("0x"$2)}' | awk '{sum+=$1} END {print sum}')
echo "丢包率: $(echo "scale=4; $dropped / $processed * 100" | bc)%"
time_squeeze 指标
- 高值表示:网络软中断处理不过来
- 可能原因:
- 单 CPU 处理太多网络中断
net.core.netdev_budget设置过低- 需要启用
RPS/RFS
性能调优
检查网络性能问题
#!/bin/bash

# 监控 softnet_stat 变化
watch -n 1 'cat /proc/net/softnet_stat | \
awk "{printf \"CPU %2d: processed=%d dropped=%d time_squeeze=%d\\n\", NR-1, strtonum(\"0x\"\$1), strtonum(\"0x\"\$2), strtonum(\"0x\"\$3)}"'
诊断网络瓶颈
#!/bin/bash

echo "检查各CPU网络负载:"
cat /proc/net/softnet_stat | \
awk '{
    processed = strtonum("0x"$1);
    dropped = strtonum("0x"$2);
    squeezed = strtonum("0x"$3);
    drop_rate = (processed > 0) ? (dropped/processed)*100 : 0;
    printf "CPU%02d: 处理数=%-8d 丢包数=%-6d 丢包率=%.4f%% 挤压数=%-6d\n",
           NR-1, processed, dropped, drop_rate, squeezed;
}'
监控脚本
#!/bin/bash

INTERVAL=5
echo "监控 softnet_stat 变化 (每 ${INTERVAL}秒)"
while true; do
    clear
    date
    echo "====================="
    cat /proc/net/softnet_stat | \
    awk '{
        printf "CPU%02d: proc=%-8d drop=%-6d squeeze=%-6d\n",
               NR-1, strtonum("0x"$1), strtonum("0x"$2), strtonum("0x"$3);
    }'
    sleep $INTERVAL
done
调优参数
# 如果 time_squeeze 较高,增加处理预算
echo 300 > /proc/sys/net/core/netdev_budget

# 启用 RPS (Receive Packet Steering)
echo f > /sys/class/net/eth0/queues/rx-0/rps_cpus
Refer
- https://github.com/esnet/iperf
- https://iperf.fr/